Technical Analysis of PHEQ 2024-05-10
Overview:
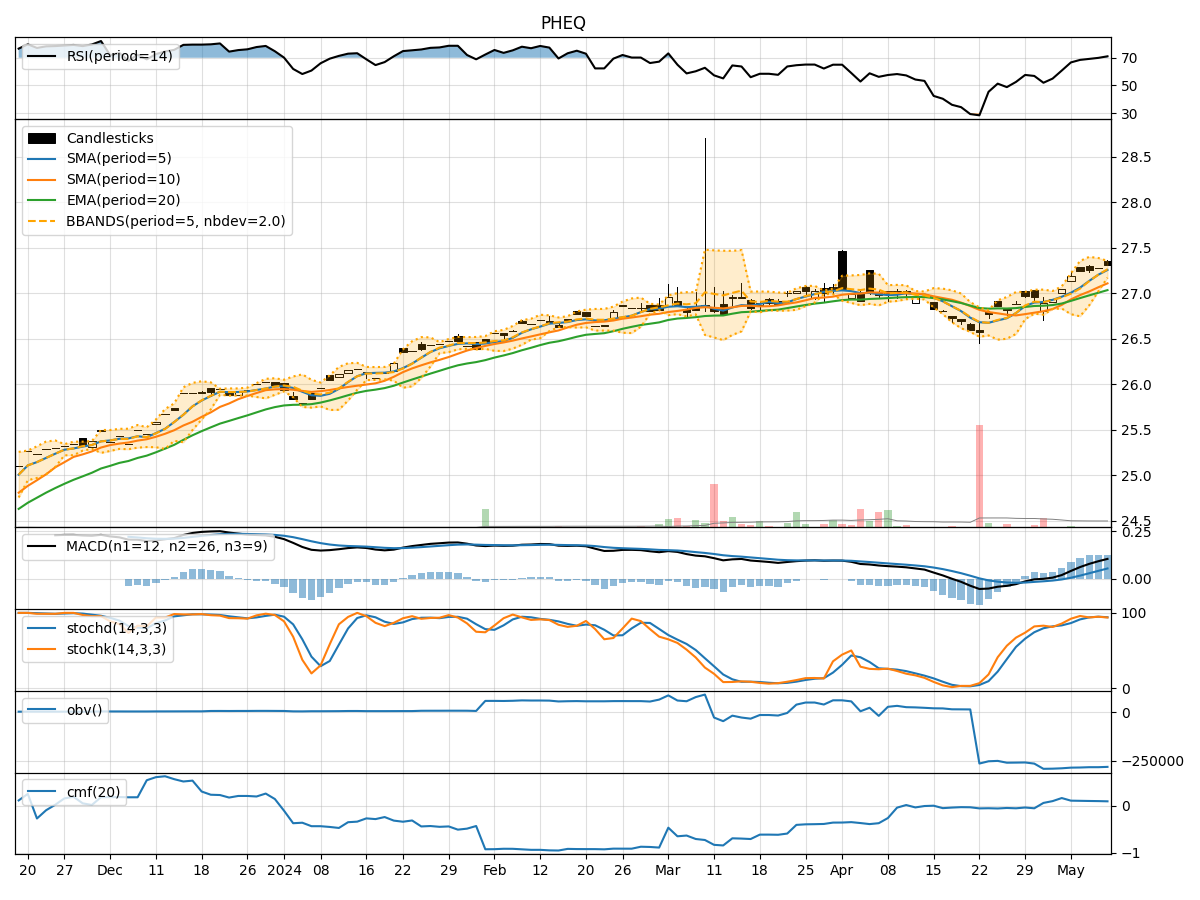
In analyzing the technical indicators for PHEQ over the last 5 days, we will delve into the trend, momentum, volatility, and volume indicators to provide a comprehensive outlook on the possible stock price movement. By examining these key aspects, we aim to offer valuable insights and predictions for the upcoming days.
Trend Analysis:
- Moving Averages (MA): The 5-day Moving Average (MA) has been consistently above the Simple Moving Average (SMA) and Exponential Moving Average (EMA), indicating a bullish trend.
- MACD: The MACD line has been consistently above the signal line, with both lines showing an upward trend, suggesting bullish momentum.
Momentum Analysis:
- RSI: The Relative Strength Index (RSI) has been trending upwards and is currently in the overbought territory, indicating a strong bullish momentum.
- Stochastic Oscillator: Both %K and %D lines of the Stochastic Oscillator are in the overbought zone, suggesting a potential reversal or consolidation.
Volatility Analysis:
- Bollinger Bands (BB): The stock price has been consistently trading above the middle Bollinger Band (BBM), indicating an uptrend. The bands are narrowing, suggesting a decrease in volatility.
Volume Analysis:
- On-Balance Volume (OBV): The OBV has been showing a slight decrease, indicating some distribution happening in the stock.
- Chaikin Money Flow (CMF): The CMF has been positive, indicating buying pressure in the stock.
Key Observations:
- The trend indicators suggest a strong bullish sentiment in the stock.
- Momentum indicators show overbought conditions, signaling a potential reversal or consolidation.
- Volatility has been decreasing, indicating a possible stabilization in price movements.
- Volume indicators show a slight decrease in buying pressure.
Conclusion:
Based on the analysis of the technical indicators, the stock of PHEQ is currently in an overbought state with a strong bullish trend. However, the momentum indicators suggest a potential reversal or consolidation in the near future. The decreasing volatility and slight decrease in buying pressure indicate a possible sideways movement or correction in the stock price.
Recommendation:
Considering the overbought conditions and potential reversal signals from the momentum indicators, it is advisable to exercise caution in entering new long positions at this point. Traders may consider taking profits on existing positions or implementing risk management strategies to protect gains. Monitoring the price action closely for signs of a reversal or consolidation would be prudent before making further trading decisions.