Technical Analysis of PHYD 2024-05-10
Overview:
In analyzing the technical indicators for PHYD stock over the last 5 days, we will delve into the trend, momentum, volatility, and volume indicators to provide a comprehensive outlook on the possible stock price movement in the coming days. By examining these key aspects, we aim to offer valuable insights and predictions for potential investors.
Trend Analysis:
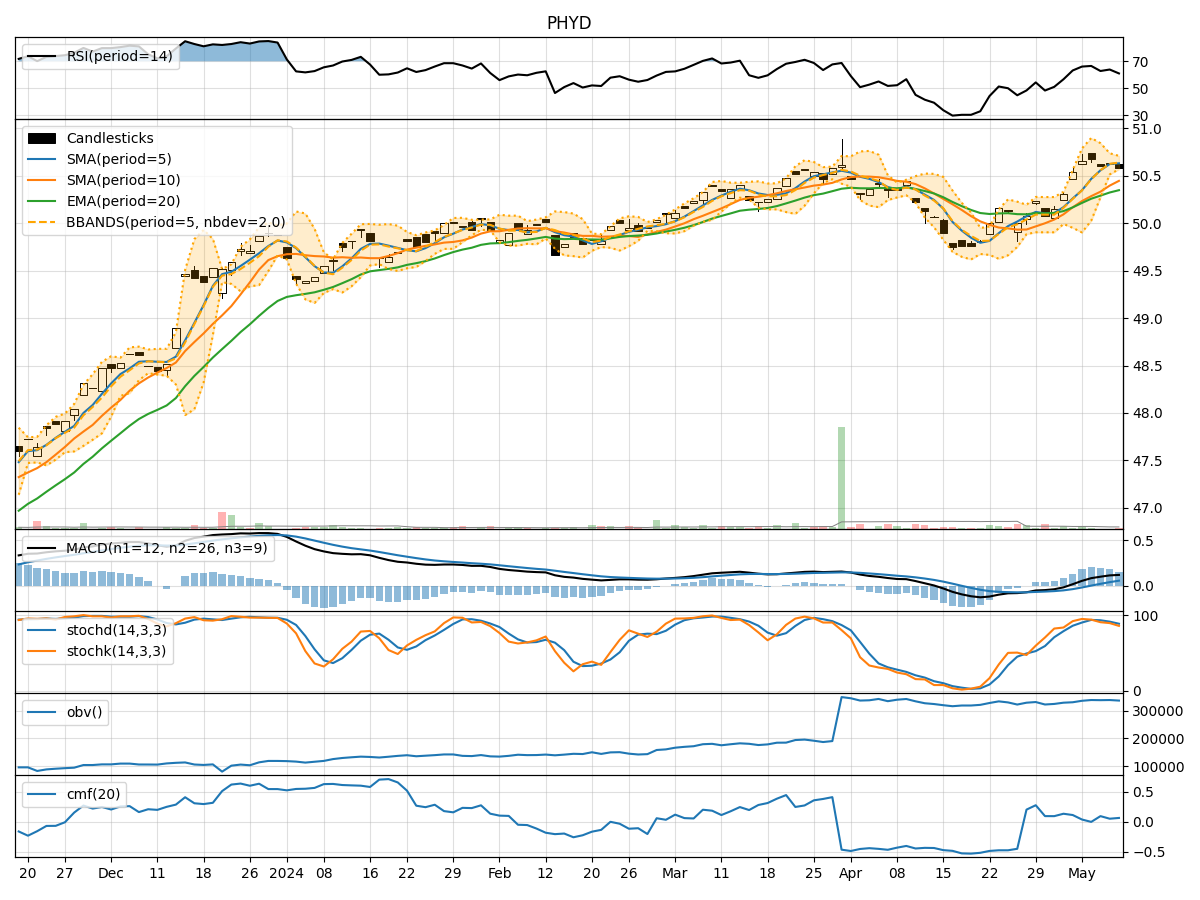
- Moving Averages (MA): The 5-day Moving Average (MA) has been consistently above the Simple Moving Average (SMA) and Exponential Moving Average (EMA), indicating a bullish trend.
- MACD: The MACD line has been above the signal line, with both showing an upward trend, suggesting bullish momentum.
Momentum Analysis:
- RSI: The Relative Strength Index (RSI) has been fluctuating around the 60-70 range, indicating a neutral momentum.
- Stochastic Oscillator: Both %K and %D have been gradually decreasing, signaling a potential bearish momentum shift.
Volatility Analysis:
- Bollinger Bands (BB): The stock price has been trading within the Bollinger Bands, with the bands narrowing, suggesting decreasing volatility.
Volume Analysis:
- On-Balance Volume (OBV): The OBV has been relatively stable, indicating consistent buying pressure.
- Chaikin Money Flow (CMF): The CMF has shown positive values, reflecting a bullish money flow into the stock.
Key Observations:
- The trend indicators suggest a strong bullish sentiment in the short term.
- Momentum indicators show a potential shift towards bearish momentum.
- Volatility has been decreasing, indicating a possible consolidation phase.
- Volume indicators point towards consistent buying pressure.
Conclusion:
Based on the analysis of the technical indicators, the next few days for PHYD stock may see mixed signals. While the trend indicators remain bullish, the momentum indicators suggest a potential bearish reversal. The decreasing volatility could lead to a consolidation phase, while the stable volume indicators indicate sustained buying interest. Investors should closely monitor the price action and key support/resistance levels for potential entry or exit points.
Recommendation:
Given the conflicting signals from the indicators, it is advisable for investors to exercise caution and wait for more clarity in the price action. Consider setting tight stop-loss orders to manage risk effectively. Further analysis and monitoring of the stock's performance are recommended before making any significant trading decisions.