Technical Analysis of PHYL 2024-05-10
Overview:
In analyzing the technical indicators for PHYL over the last 5 days, we will delve into the trend, momentum, volatility, and volume indicators to provide a comprehensive outlook on the possible stock price movement in the coming days. By examining these key indicators, we aim to offer valuable insights and predictions for potential investors.
Trend Indicators:
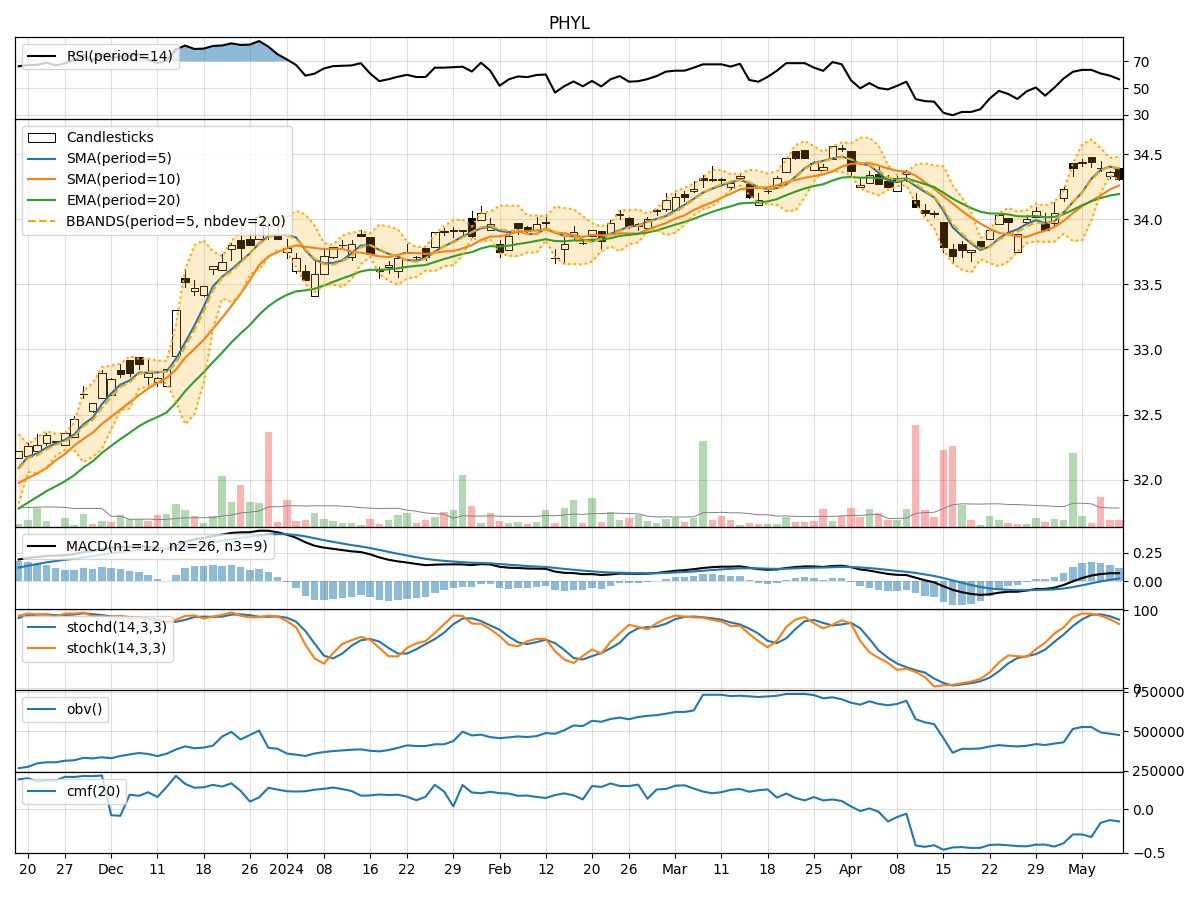
- Moving Averages (MA): The 5-day Moving Average (MA) has been relatively stable around the closing prices, indicating a consistent trend in the short term.
- MACD: The Moving Average Convergence Divergence (MACD) has shown a positive trend, with the MACD line consistently above the signal line, suggesting bullish momentum.
- EMA: The Exponential Moving Average (EMA) has been gradually increasing, reflecting a positive trend in the stock price.
Momentum Indicators:
- RSI: The Relative Strength Index (RSI) has been in the neutral zone, indicating neither overbought nor oversold conditions.
- Stochastic Oscillator: Both %K and %D have been declining, signaling a potential bearish momentum in the stock.
- Williams %R: The Williams %R indicator has been moving lower into oversold territory, suggesting a possible reversal in the stock price.
Volatility Indicators:
- Bollinger Bands: The Bollinger Bands have been narrowing, indicating decreasing volatility in the stock price.
- Bollinger %B: The %B indicator has been hovering around the middle range, suggesting a period of consolidation.
- Average True Range (ATR): The ATR has been relatively stable, indicating consistent price movements without significant spikes.
Volume Indicators:
- On-Balance Volume (OBV): The OBV has been declining, indicating selling pressure in the stock.
- Chaikin Money Flow (CMF): The CMF has been negative, suggesting a lack of buying interest in the stock.
Conclusion:
Based on the analysis of the technical indicators, the stock of PHYL is likely to experience further downward movement in the coming days. The bearish momentum indicated by the Stochastic Oscillator and Williams %R, coupled with the declining OBV and negative CMF, suggest a lack of buying interest and potential selling pressure. Additionally, the narrowing Bollinger Bands and stable ATR point towards a period of consolidation or a possible downward trend.
Investors should exercise caution and consider waiting for more definitive signals before making any investment decisions. The overall outlook for PHYL appears bearish in the short term, with a potential for further downside movement.