Technical Analysis of PICK 2024-05-10
Overview:
In analyzing the technical indicators for the stock PICK over the last 5 days, we will delve into the trends, momentum, volatility, and volume indicators to provide a comprehensive outlook on the possible stock price movement in the coming days. By examining these key indicators, we aim to offer valuable insights and predictions for informed decision-making.
Trend Indicators:
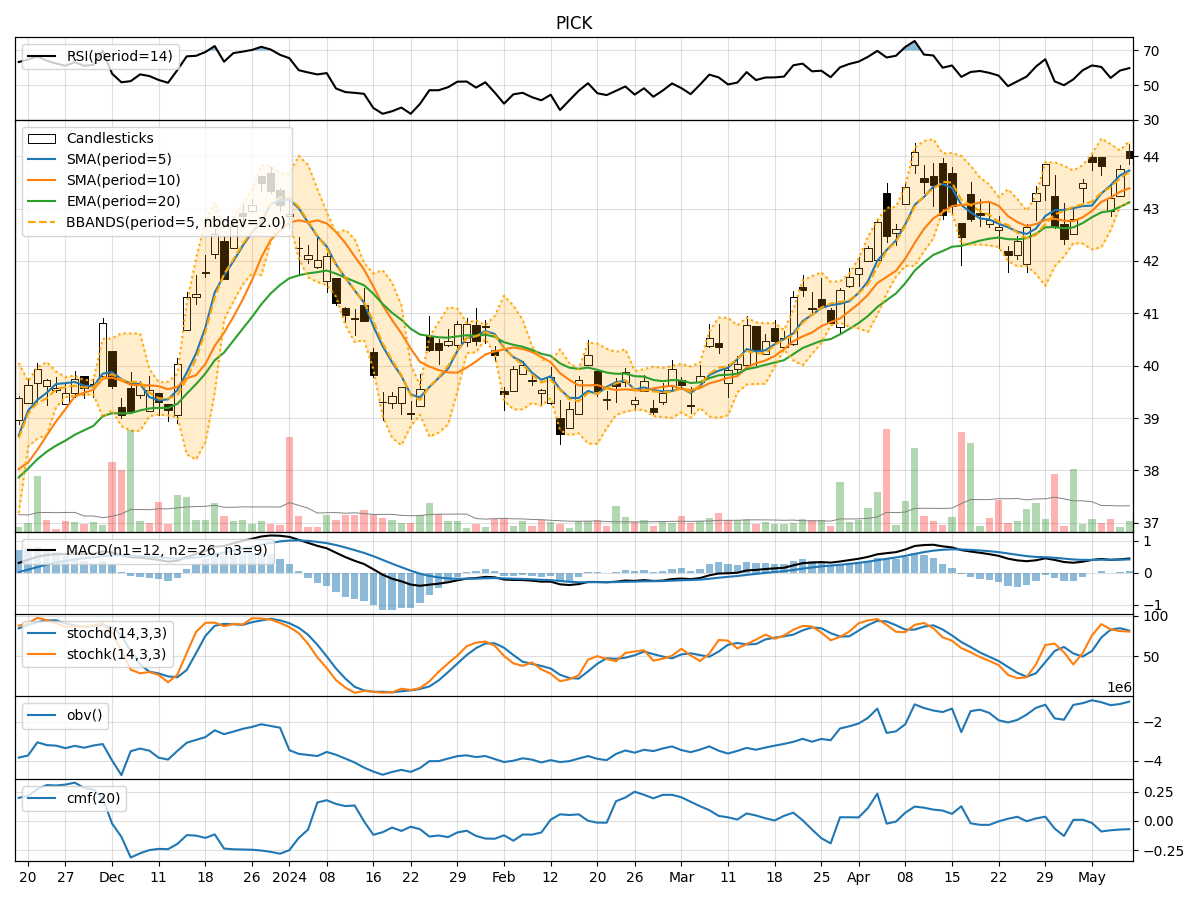
- Moving Averages (MA): The 5-day Moving Average (MA) has been consistently above the Simple Moving Average (SMA) and Exponential Moving Average (EMA), indicating a bullish trend.
- MACD: The MACD line has been consistently above the signal line, with positive values, suggesting a bullish momentum.
- MACD Histogram: The MACD Histogram has shown positive values, indicating an increasing bullish momentum.
Momentum Indicators:
- RSI: The Relative Strength Index (RSI) has been fluctuating around the 50 level, indicating a neutral momentum.
- Stochastic Oscillator: Both %K and %D have been hovering around the overbought zone, suggesting a potential reversal or consolidation.
- Williams %R: The Williams %R has been fluctuating near the oversold territory, indicating a potential buying opportunity.
Volatility Indicators:
- Bollinger Bands: The Bollinger Bands have shown narrowing bands, indicating decreasing volatility and a potential price breakout.
- Bollinger %B: The %B indicator has been fluctuating within the bands, suggesting a consolidation phase.
- Average True Range (ATR): The ATR has shown a decrease in volatility, indicating a potential period of price stability.
Volume Indicators:
- On-Balance Volume (OBV): The OBV has shown a slight decrease, indicating some distribution in the stock.
- Chaikin Money Flow (CMF): The CMF has been negative, suggesting selling pressure in the stock.
Key Observations and Opinions:
- Trend: The stock has been in a bullish trend based on moving averages and MACD analysis.
- Momentum: The momentum indicators suggest a neutral to slightly bearish sentiment.
- Volatility: Volatility has been decreasing, indicating a potential period of consolidation.
- Volume: The volume indicators show some distribution and selling pressure in the stock.
Conclusion:
Based on the analysis of the technical indicators, the stock PICK is likely to experience sideways consolidation in the coming days. While the trend remains bullish, the momentum and volume indicators suggest a neutral to slightly bearish sentiment. The decreasing volatility and distribution in volume indicate a period of consolidation where the stock price may trade within a range. Traders should exercise caution and wait for clearer signals before making significant trading decisions.