Technical Analysis of PID 2024-05-10
Overview:
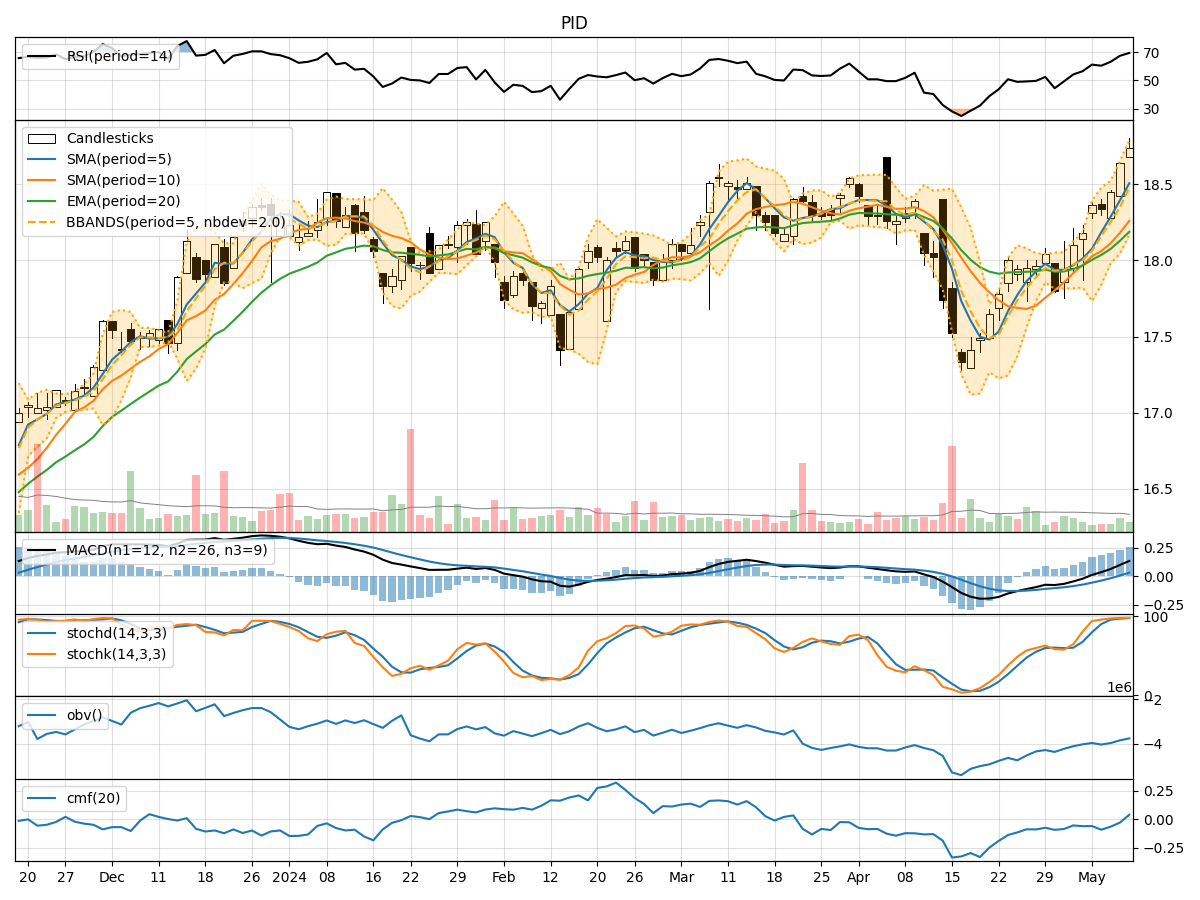
In analyzing the technical indicators for PID stock over the last 5 days, we will delve into the trend, momentum, volatility, and volume indicators to forecast the possible stock price movement in the upcoming days. By examining these key indicators, we aim to provide a comprehensive and insightful analysis to guide your investment decisions.
Trend Indicators:
- Moving Averages (MA): The 5-day moving average has been consistently rising, indicating a bullish trend in the short term.
- MACD: The MACD line has been increasing, showing positive momentum in the stock price.
- MACD Histogram: The histogram has been rising, suggesting strengthening bullish momentum.
Momentum Indicators:
- RSI: The RSI has been increasing, indicating growing buying pressure and potential overbought conditions.
- Stochastic Oscillator: Both %K and %D have been high, signaling a strong bullish momentum.
- Williams %R: The indicator has been fluctuating but generally in the oversold territory.
Volatility Indicators:
- Bollinger Bands: The stock price has been trading within the bands, showing moderate volatility.
- Bollinger %B: The %B indicator has been fluctuating around the midline, indicating a balanced market sentiment.
Volume Indicators:
- On-Balance Volume (OBV): The OBV has been mixed, suggesting indecision among investors.
- Chaikin Money Flow (CMF): The CMF has been negative, indicating outflows from the stock.
Key Observations:
- The trend indicators suggest a bullish sentiment in the short term.
- Momentum indicators point towards strong buying pressure and potential overbought conditions.
- Volatility indicators show moderate price fluctuations within the Bollinger Bands.
- Volume indicators reflect mixed investor sentiment with negative money flow.
Conclusion:
Based on the analysis of the technical indicators, the next few days for PID stock are likely to see continued upward movement with strong bullish momentum. However, caution is advised due to potential overbought conditions indicated by the RSI. The stock may experience moderate volatility within the Bollinger Bands, but the overall trend remains bullish. Investors should closely monitor the price action and consider taking profits if the stock becomes significantly overbought.