Technical Analysis of PIN 2024-05-10
Overview:
In analyzing the technical indicators for the stock of PIN over the last 5 days, we will delve into the trends, momentum, volatility, and volume indicators to provide a comprehensive assessment of the possible future stock price movement. By examining these key aspects, we aim to offer valuable insights and recommendations for potential investors.
Trend Indicators:
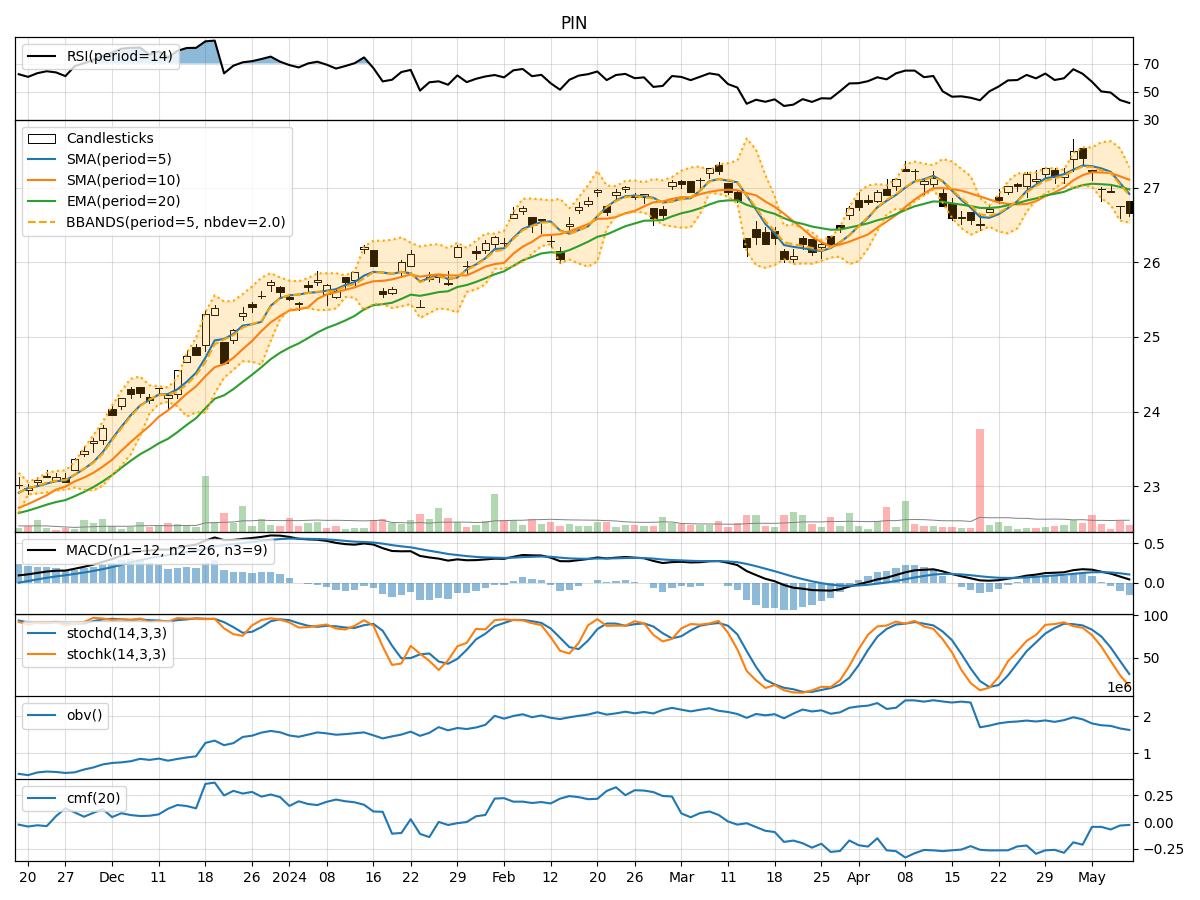
- Moving Averages (MA): The 5-day Moving Average (MA) has been consistently below the Simple Moving Average (SMA) and Exponential Moving Average (EMA), indicating a downward trend in the stock price.
- MACD: The MACD line has been decreasing over the past 5 days, with the MACD line below the signal line, suggesting a bearish momentum in the stock.
- MACD Histogram: The MACD Histogram has also been declining, further supporting the bearish sentiment in the stock.
Momentum Indicators:
- RSI: The Relative Strength Index (RSI) has been decreasing and is currently below 50, indicating a weakening momentum in the stock.
- Stochastic Oscillator: Both %K and %D lines of the Stochastic Oscillator have been declining, showing a bearish momentum in the stock.
- Williams %R: The Williams %R is in the oversold territory, suggesting a potential reversal or bounce in the stock price.
Volatility Indicators:
- Bollinger Bands: The Bollinger Bands have been narrowing, indicating decreasing volatility in the stock price.
- Bollinger %B: The %B indicator is below 0.2, suggesting that the stock is oversold and may see a potential reversal in the near future.
Volume Indicators:
- On-Balance Volume (OBV): The OBV has been consistently decreasing over the last 5 days, indicating selling pressure in the stock.
- Chaikin Money Flow (CMF): The CMF is negative, suggesting that money is flowing out of the stock.
Conclusion:
Based on the analysis of the technical indicators, the stock of PIN is currently in a bearish trend with weakening momentum and decreasing volatility. The selling pressure indicated by the volume indicators further supports the bearish outlook. Therefore, the next few days are likely to see a continuation of the downward trend in the stock price. Investors should exercise caution and consider waiting for a more favorable entry point before considering any long positions.