Technical Analysis of PIT 2024-05-10
Overview:
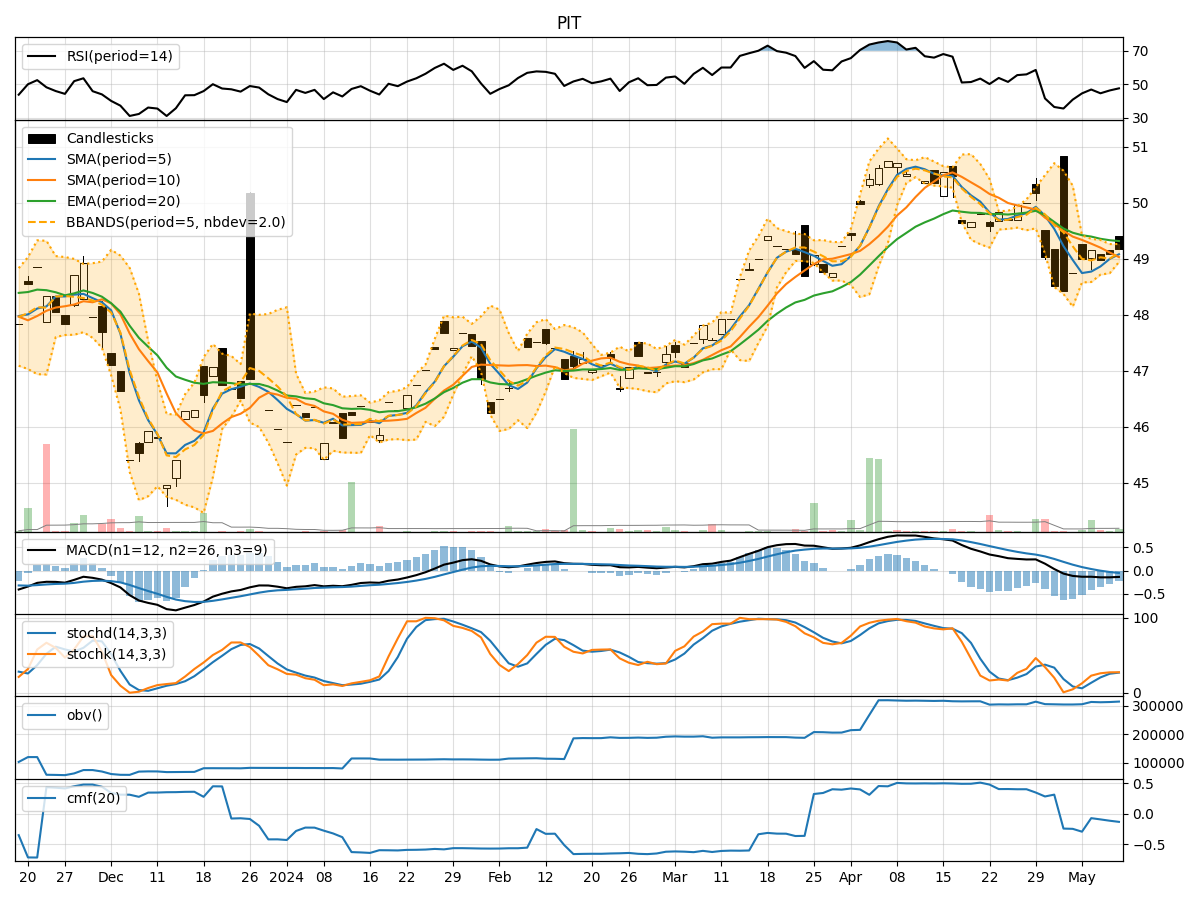
In analyzing the provided Technical Analysis (TA) data for the last 5 days of the stock, we will delve into the trend, momentum, volatility, and volume indicators to derive insights into the possible future stock price movement. By examining these key indicators, we aim to provide a comprehensive analysis and make informed predictions for the upcoming days.
Trend Analysis:
- Moving Averages (MA): The 5-day Moving Average (MA) has been fluctuating around the closing prices, indicating a relatively stable trend.
- MACD: The Moving Average Convergence Divergence (MACD) has been negative, suggesting a bearish momentum in the short term.
- EMA: The Exponential Moving Average (EMA) has been declining, reflecting a downward trend in the stock price.
Momentum Analysis:
- RSI: The Relative Strength Index (RSI) has been hovering around the mid-range, indicating a neutral momentum.
- Stochastic Oscillator: Both %K and %D have been relatively low, suggesting a lack of strong momentum in either direction.
- Williams %R: The Williams %R is in the oversold territory, indicating a potential reversal in the short term.
Volatility Analysis:
- Bollinger Bands (BB): The Bollinger Bands have been narrowing, indicating decreasing volatility in the stock price.
- BB %B: The %B indicator has been fluctuating within a tight range, signaling a period of consolidation.
- BB Width: The Bollinger Bands Width has been contracting, suggesting a potential breakout or significant price movement ahead.
Volume Analysis:
- On-Balance Volume (OBV): The OBV has been relatively flat, indicating a balance between buying and selling pressure.
- Chaikin Money Flow (CMF): The CMF has been negative, suggesting a net outflow of money from the stock.
Key Observations and Opinions:
- Trend: The trend indicators point towards a bearish sentiment in the short term, with the MACD and EMA signaling a downward trajectory.
- Momentum: The momentum indicators suggest a lack of strong buying or selling pressure, with RSI and Stochastic Oscillator reflecting a neutral stance.
- Volatility: The decreasing volatility, as indicated by the Bollinger Bands, may lead to a period of consolidation or a potential breakout.
- Volume: The volume indicators show a balanced market sentiment, with no clear dominance of buying or selling pressure.
Conclusion:
Based on the analysis of the technical indicators, the stock is likely to experience sideways movement in the upcoming days, with a potential for a short-term bearish bias. Traders should exercise caution and closely monitor key support and resistance levels for any potential breakout or reversal signals. It is advisable to wait for more definitive signals before taking significant trading positions.