Technical Analysis of PJAN 2024-05-10
Overview:
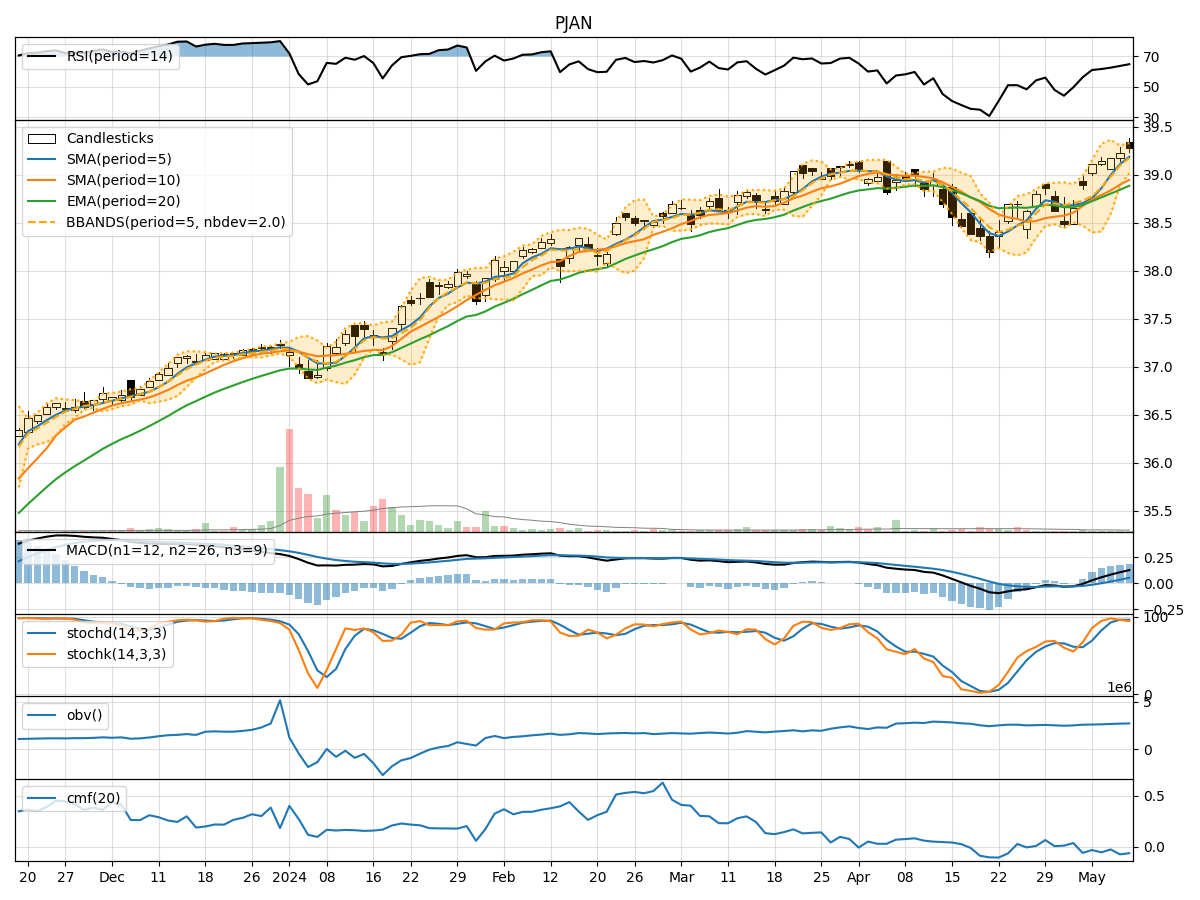
In analyzing the technical indicators for PJAN stock over the last 5 days, we will delve into the trends, momentum, volatility, and volume indicators to provide a comprehensive outlook on the possible stock price movement in the coming days. By examining key metrics such as moving averages, MACD, RSI, Bollinger Bands, and OBV, we aim to offer valuable insights and predictions for informed decision-making.
Trend Indicators:
- Moving Averages (MA): The 5-day MA has been consistently above the closing prices, indicating a bullish trend.
- MACD: The MACD line has been above the signal line, suggesting positive momentum.
- EMA: The exponential moving average has been trending upwards, supporting the bullish sentiment.
Momentum Indicators:
- RSI: The RSI has been in the overbought territory, indicating strong buying momentum.
- Stochastic Oscillator: Both %K and %D have been in the overbought zone, signaling a potential reversal.
- Williams %R: The indicator has been in the oversold region, suggesting a possible price correction.
Volatility Indicators:
- Bollinger Bands: The stock price has been trading within the bands, indicating moderate volatility.
- Bollinger %B: The %B value has been fluctuating around 0.8, suggesting a balanced market sentiment.
Volume Indicators:
- On-Balance Volume (OBV): The OBV has been relatively stable, indicating consistent buying pressure.
- Chaikin Money Flow (CMF): The CMF has been negative, reflecting a slight outflow of money from the stock.
Key Observations:
- The stock is currently in an upward trend supported by moving averages and MACD.
- Momentum indicators like RSI and Stochastic Oscillator suggest a potential overbought condition, signaling a caution for traders.
- Volatility remains moderate based on Bollinger Bands, indicating stable price movements.
- Volume indicators show consistent buying pressure but a slight outflow of money based on CMF.
Conclusion:
Based on the technical analysis of trend, momentum, volatility, and volume indicators, the next few days for PJAN stock are likely to see further upward movement in price. However, caution is advised due to the overbought signals from momentum indicators. Traders should closely monitor price action and consider taking profits or implementing risk management strategies to navigate potential corrections. Overall, the outlook remains bullish with a possibility of consolidation before potential continuation of the uptrend.