Technical Analysis of PJBF 2024-05-10
Overview:
In analyzing the technical indicators for PJBF over the last 5 days, we will delve into the trend, momentum, volatility, and volume indicators to provide a comprehensive outlook on the possible stock price movement in the coming days.
Trend Analysis:
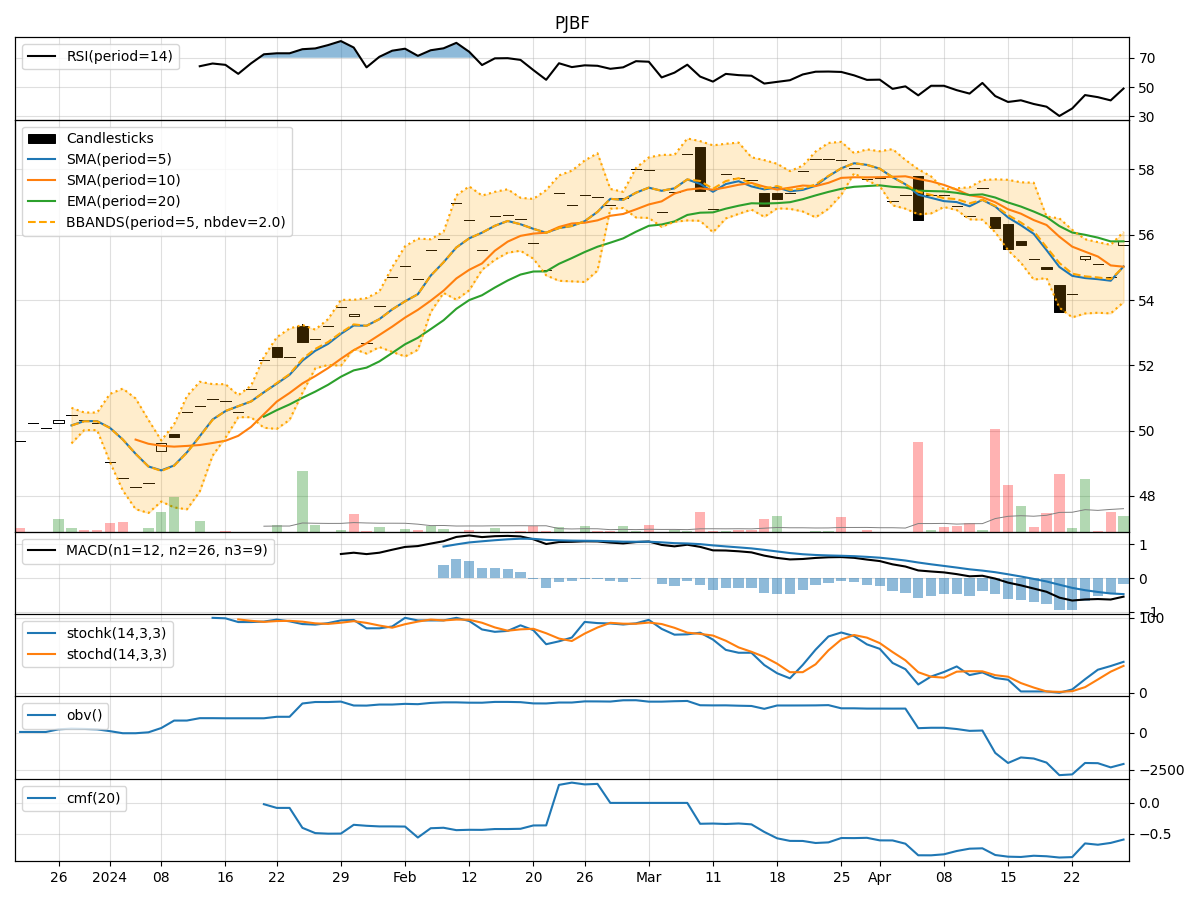
- Moving Averages (MA): The 5-day Moving Average (MA) has been consistently above the Simple Moving Average (SMA) and Exponential Moving Average (EMA), indicating a bullish trend.
- MACD: The Moving Average Convergence Divergence (MACD) has been positive, with the MACD line above the Signal line, suggesting upward momentum.
Momentum Analysis:
- RSI: The Relative Strength Index (RSI) has been in the overbought territory, indicating a strong bullish momentum.
- Stochastic Oscillator: Both %K and %D have been in the overbought zone, signaling a potential reversal or consolidation.
Volatility Analysis:
- Bollinger Bands (BB): The stock price has been trading within the upper Bollinger Band, suggesting an overbought condition.
Volume Analysis:
- On-Balance Volume (OBV): The OBV has been relatively stable, indicating a balance between buying and selling pressure.
- Chaikin Money Flow (CMF): The CMF has been negative, reflecting a bearish money flow trend.
Key Observations:
- The trend indicators suggest a strong bullish sentiment in the short term.
- Momentum indicators indicate a potential overbought condition, signaling a need for caution.
- Volatility indicators point towards a high level of price fluctuation.
- Volume indicators show a balanced buying and selling pressure.
Conclusion:
Based on the analysis of the technical indicators, the next few days' possible stock price movement for PJBF is likely to be sideways to slightly bearish. While the trend remains bullish, the overbought momentum and high volatility may lead to a period of consolidation or a minor pullback in the stock price. Traders should closely monitor key support and resistance levels for potential entry or exit points.
Recommendation:
- Short-term Traders: Consider taking profits or tightening stop-loss levels to manage risk.
- Long-term Investors: Monitor the price action for potential buying opportunities during pullbacks.
By combining insights from trend, momentum, volatility, and volume indicators, investors can make informed decisions to navigate the market dynamics effectively.