Technical Analysis of PJFM 2024-05-10
Overview:
In analyzing the technical indicators for PJFM stock over the last 5 days, we will delve into the trend, momentum, volatility, and volume indicators to provide a comprehensive outlook on the possible future stock price movement. By examining these key indicators, we aim to offer valuable insights and predictions for the upcoming trading days.
Trend Indicators:
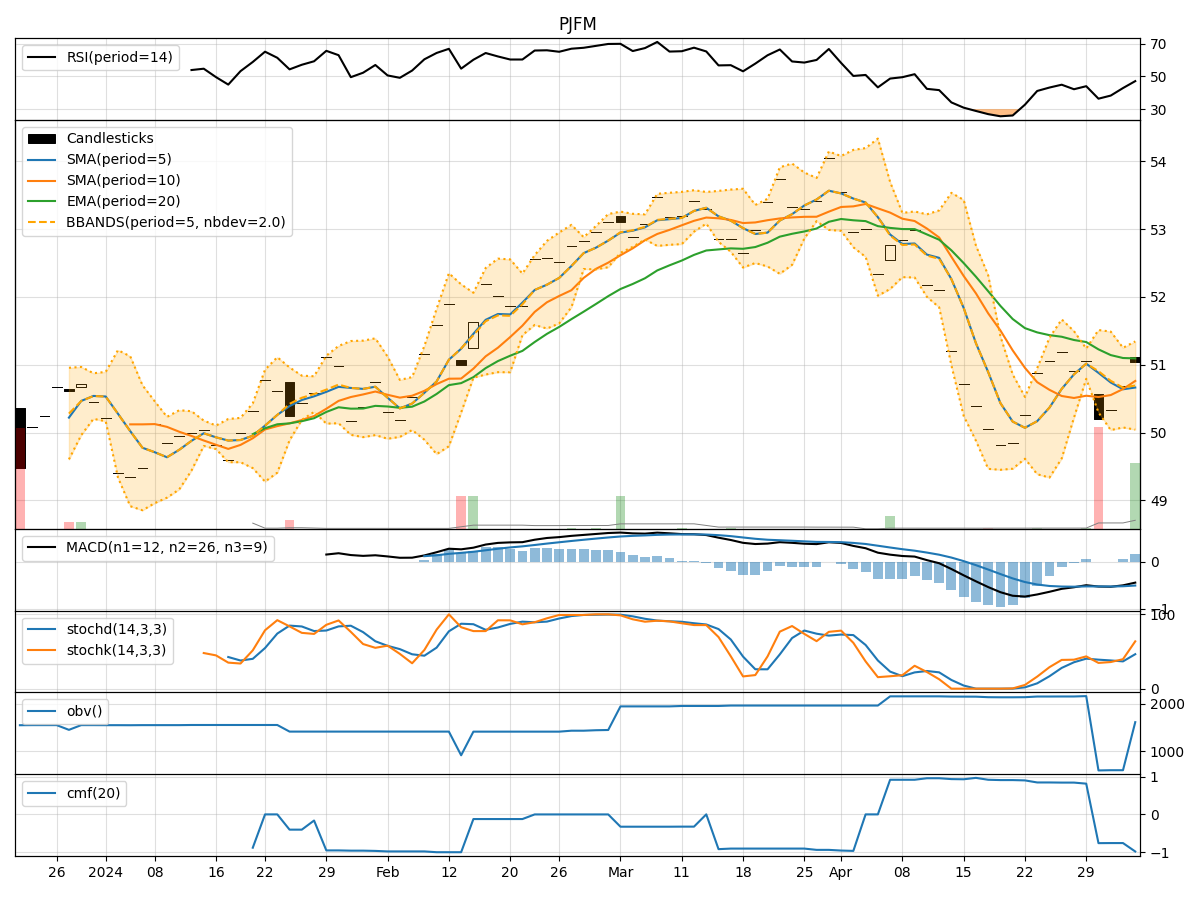
- Moving Averages (MA): The 5-day Moving Average (MA) has been consistently above the Simple Moving Average (SMA) and Exponential Moving Average (EMA), indicating a bullish trend.
- MACD: The Moving Average Convergence Divergence (MACD) has shown positive values, with the MACD line consistently above the Signal line, suggesting bullish momentum.
- MACD Histogram: The MACD Histogram has been increasing over the past 5 days, indicating strengthening bullish momentum.
Momentum Indicators:
- RSI: The Relative Strength Index (RSI) has been trending upwards, reaching levels above 50, indicating increasing buying pressure.
- Stochastic Oscillator: Both %K and %D lines of the Stochastic Oscillator have been in the overbought zone, suggesting a strong bullish momentum.
- Williams %R: The Williams %R indicator has been consistently at or near the oversold level, indicating a potential reversal to the upside.
Volatility Indicators:
- Bollinger Bands: The Bollinger Bands have been widening, indicating increased volatility in the stock price.
- Bollinger %B: The %B indicator has been fluctuating within the bands, suggesting potential price reversals or breakouts.
- Bollinger Band Width: The Band Width has been expanding, indicating a potential increase in price volatility.
Volume Indicators:
- On-Balance Volume (OBV): The OBV has been relatively stable, indicating consistent buying volume.
- Chaikin Money Flow (CMF): The CMF has been negative, suggesting a lack of buying pressure in the stock.
Key Observations and Opinions:
- Trend: The stock is in a strong bullish trend based on moving averages and MACD indicators.
- Momentum: Momentum indicators suggest a strong bullish sentiment with overbought conditions.
- Volatility: Increasing volatility may lead to potential price swings or breakouts.
- Volume: Stable buying volume but lack of strong buying pressure based on CMF.
Conclusion:
Based on the analysis of the technical indicators, the next few days for PJFM stock are likely to see continued upward movement. The bullish trend, strong momentum, and increasing volatility indicate potential for further price appreciation. Traders and investors may consider buying opportunities in PJFM stock based on the current technical outlook.