Technical Analysis of PJFV 2024-05-10
Overview:
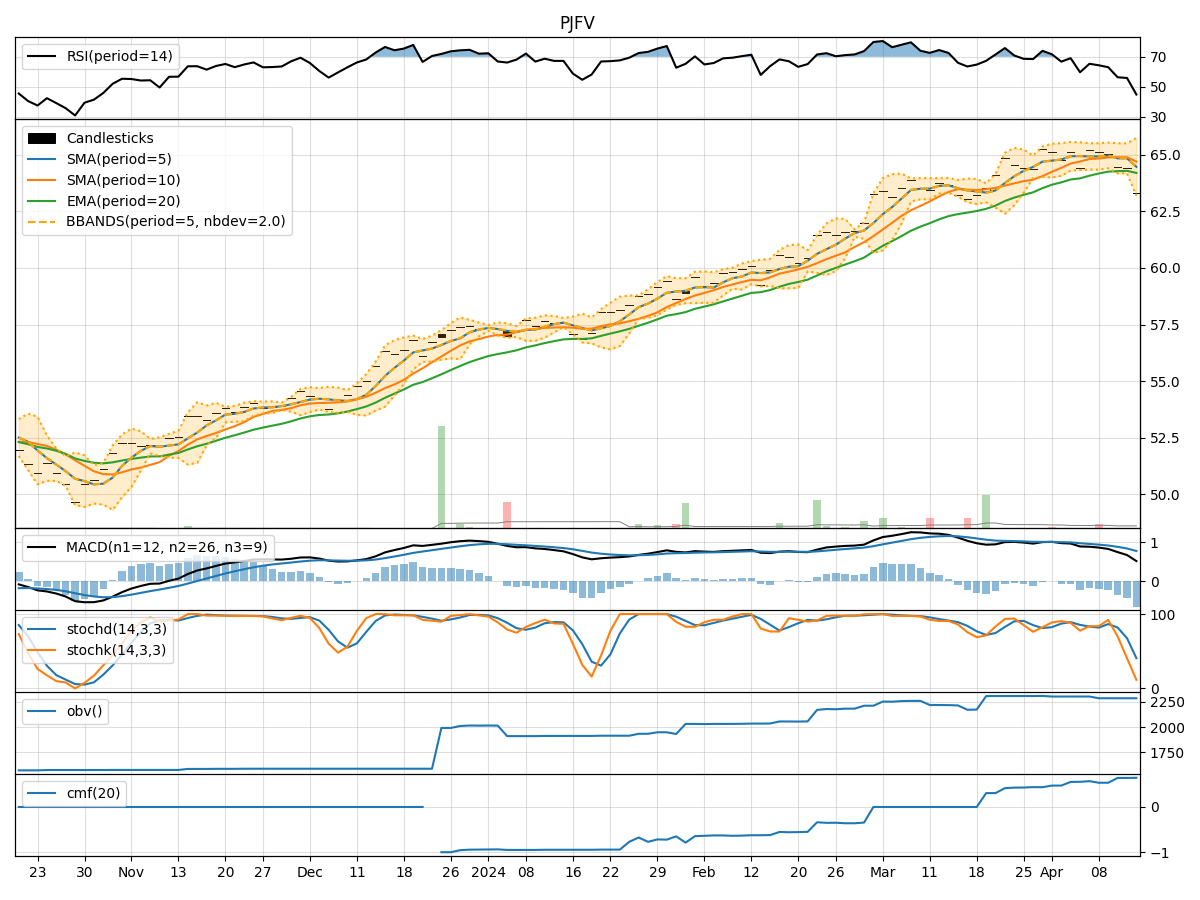
In analyzing the technical indicators for PJFV over the last 5 days, we will delve into the trends, momentum, volatility, and volume indicators to provide a comprehensive outlook on the possible stock price movement in the coming days. By examining key metrics such as moving averages, MACD, RSI, Bollinger Bands, and OBV, we aim to offer valuable insights and predictions for potential price action.
Trend Indicators:
- Moving Averages (MA): The 5-day MA has been consistently above the closing prices, indicating a bullish trend.
- MACD: The MACD line has been trending upwards, with the MACD histogram showing positive values, suggesting bullish momentum.
- EMA: The EMA has been steadily increasing, supporting the bullish trend.
Momentum Indicators:
- RSI: The RSI has been rising, indicating increasing buying pressure and potential overbought conditions.
- Stochastic Oscillator: Both %K and %D have been in the overbought zone, signaling a strong bullish momentum.
- Williams %R: The indicator has been consistently at or near the oversold level, suggesting a potential reversal.
Volatility Indicators:
- Bollinger Bands (BB): The stock price has been trading within the bands, with the bands narrowing, indicating decreasing volatility.
- Bollinger %B: The %B value has been hovering around 0.8, suggesting the stock is trading near the upper band.
Volume Indicators:
- On-Balance Volume (OBV): The OBV has been steadily increasing, indicating strong buying volume.
- Chaikin Money Flow (CMF): The CMF has been positive, reflecting buying pressure and accumulation.
Key Observations:
- The stock is in a strong bullish trend based on moving averages and MACD.
- Momentum indicators suggest overbought conditions, potentially leading to a pullback.
- Volatility has been decreasing, indicating a possible period of consolidation.
- Volume indicators show consistent buying pressure and accumulation.
Conclusion:
Based on the analysis of the technical indicators, the stock is likely to experience a short-term pullback or consolidation due to overbought conditions indicated by momentum indicators like RSI and Stochastic Oscillator. However, the overall trend remains bullish, supported by moving averages and MACD. Traders should be cautious of potential profit-taking or a minor correction before the uptrend resumes. It is advisable to monitor key support levels and volume dynamics for confirmation of the bullish bias.