Technical Analysis of PJIO 2024-05-10
Overview:
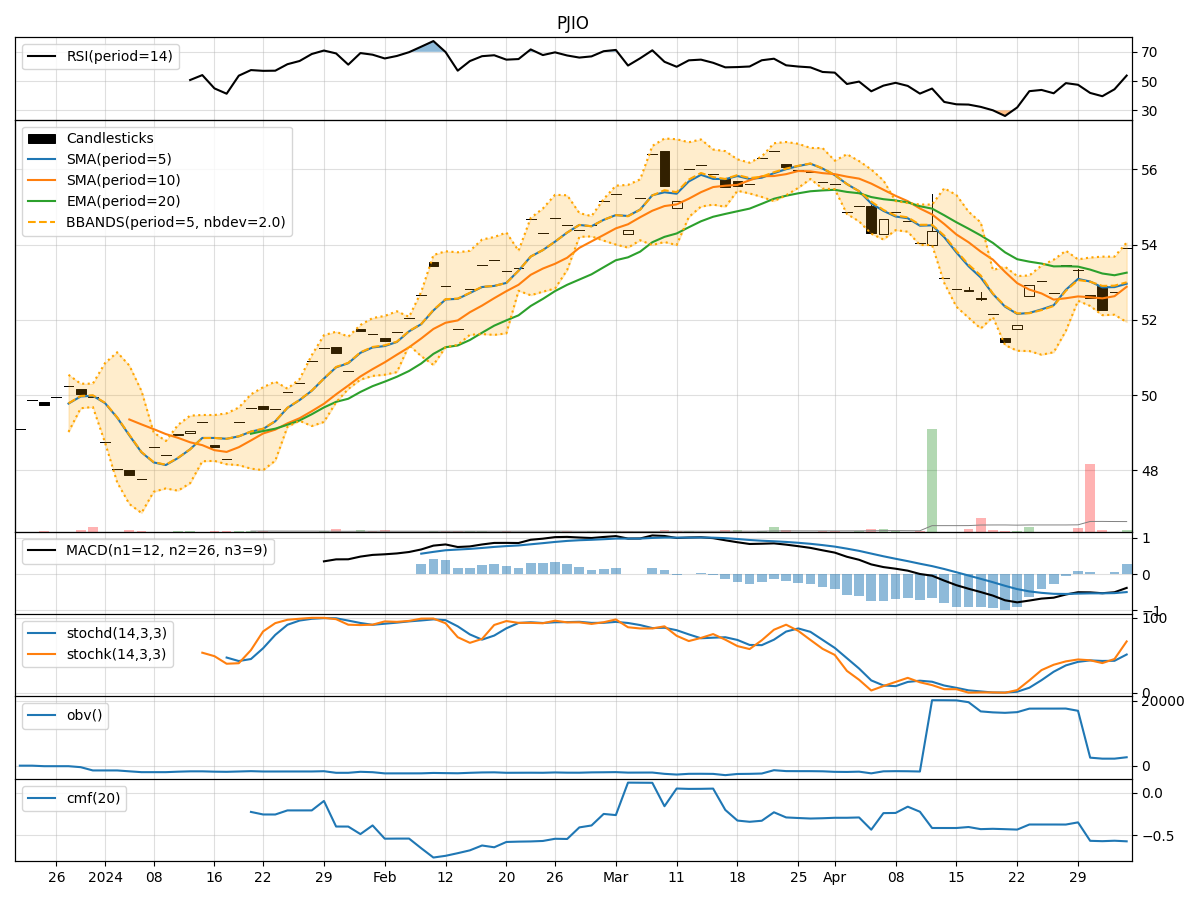
In analyzing the technical indicators for PJIO stock over the last 5 days, we will delve into the trend, momentum, volatility, and volume indicators to provide a comprehensive outlook on the possible stock price movement in the coming days. By examining these key aspects, we aim to offer valuable insights and recommendations for potential investors.
Trend Analysis:
- Moving Averages (MA): The 5-day Moving Average (MA) has been consistently above the Simple Moving Average (SMA) and Exponential Moving Average (EMA), indicating a bullish trend.
- MACD: The MACD line has been consistently above the signal line, with both lines showing an upward trend, suggesting bullish momentum.
- MACD Histogram: The MACD Histogram has been increasing over the past 5 days, indicating strengthening bullish momentum.
Momentum Analysis:
- RSI: The Relative Strength Index (RSI) has been gradually increasing and is currently in the overbought territory, signaling a strong bullish momentum.
- Stochastic Oscillator: Both %K and %D lines of the Stochastic Oscillator have been at 100%, indicating strong bullish momentum.
- Williams %R: The Williams %R is at 0.0, suggesting an overbought condition.
Volatility Analysis:
- Bollinger Bands (BB): The stock price has been consistently trading above the middle Bollinger Band (BBM), indicating an upward trend.
- Bollinger Band Width (BBW): The Bollinger Band Width has been narrowing, suggesting decreasing volatility.
- Bollinger Band %B (BBP): The %B indicator has been increasing, indicating a bullish trend.
Volume Analysis:
- On-Balance Volume (OBV): The OBV has been steadily increasing over the past 5 days, indicating accumulation by investors.
- Chaikin Money Flow (CMF): The CMF has been negative but improving, suggesting a potential shift towards buying pressure.
Conclusion:
Based on the analysis of the technical indicators, the next few days for PJIO stock are likely to see continued upward movement. The bullish trend indicated by the moving averages, MACD, and RSI, coupled with strong momentum shown by the Stochastic Oscillator and Williams %R, support a positive outlook. Additionally, the narrowing Bollinger Bands and increasing OBV signal potential price appreciation.
Therefore, it is recommended to consider buying or holding PJIO stock in the coming days, as the technical indicators point towards further upside potential. However, it is essential to monitor the indicators closely for any signs of reversal or divergence to adjust the trading strategy accordingly.