Technical Analysis of PJP 2024-05-10
Overview:
In analyzing the technical indicators for PJP stock over the last 5 days, we will delve into the trends, momentum, volatility, and volume aspects to provide a comprehensive outlook on the possible stock price movement in the coming days. By examining key indicators such as moving averages, MACD, RSI, Bollinger Bands, and OBV, we aim to offer valuable insights and predictions for potential price action.
Trend Analysis:
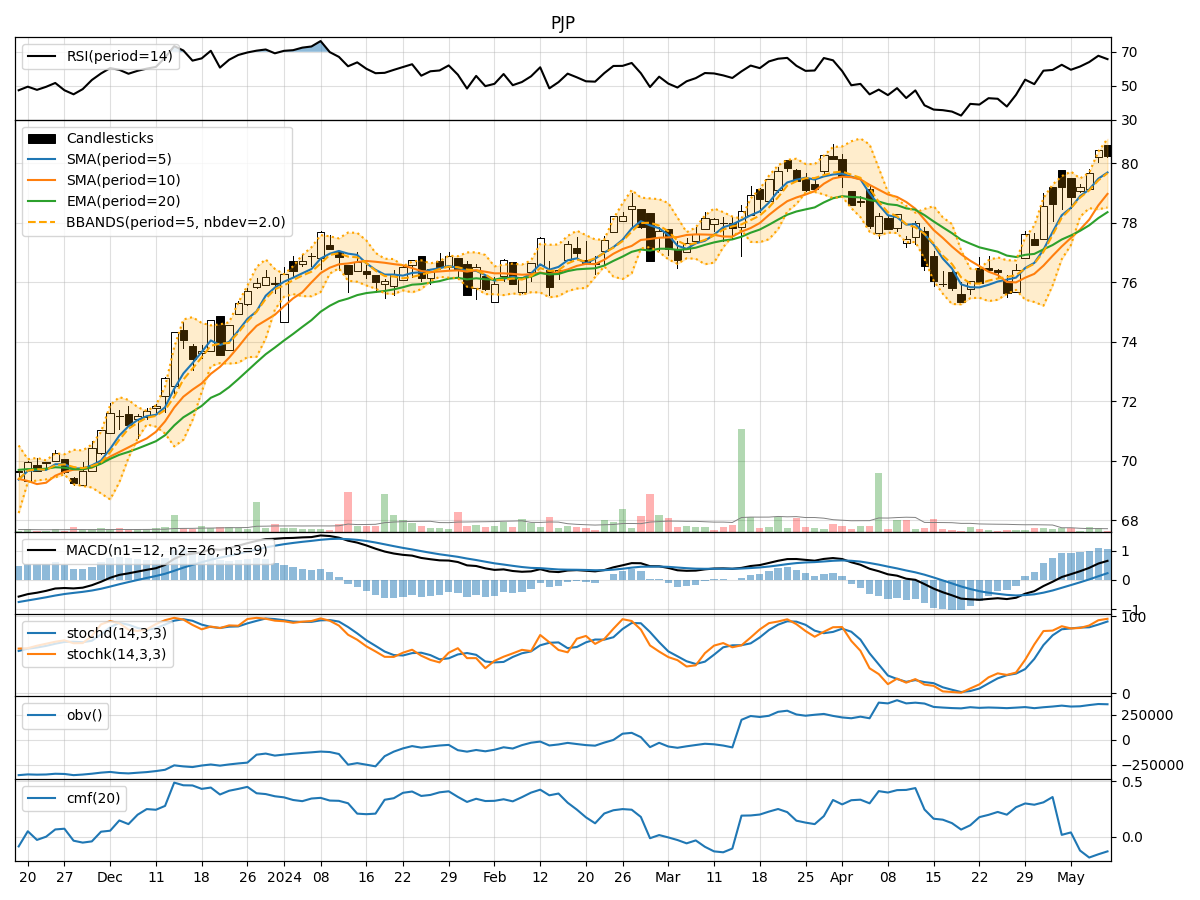
- Moving Averages (MA): The 5-day moving average has been consistently above the simple moving average (SMA) of 10 days, indicating a short-term bullish trend.
- MACD: The MACD line has been above the signal line for the past few days, suggesting positive momentum in the stock price.
- EMA: The exponential moving average has been trending upwards, reflecting a bullish sentiment in the market.
Momentum Analysis:
- RSI: The Relative Strength Index has been gradually increasing and is currently in the overbought territory, signaling a strong bullish momentum.
- Stochastic Oscillator: Both %K and %D lines are in the overbought zone, indicating a potential reversal or consolidation phase.
- Williams %R: The Williams %R is in the oversold region, suggesting a possible reversal in the short term.
Volatility Analysis:
- Bollinger Bands: The stock price has been trading within the upper Bollinger Band, indicating an overbought condition. However, the bands are widening, suggesting increased volatility.
- Bollinger %B: The %B indicator is above 0.5, indicating a bullish trend in the short term.
Volume Analysis:
- On-Balance Volume (OBV): The OBV has been showing a slight increase over the last few days, indicating accumulation by investors.
- Chaikin Money Flow (CMF): The CMF is negative, suggesting some selling pressure in the market.
Conclusion:
Based on the analysis of the technical indicators, the stock price of PJP is likely to experience further upward movement in the coming days. The bullish trends in moving averages, MACD, and RSI, coupled with the overbought conditions in momentum indicators, indicate a strong buying sentiment in the market. However, caution is advised as the stochastic oscillator suggests a potential reversal, and the CMF indicates some selling pressure. Traders should closely monitor the price action and consider taking profits or implementing risk management strategies to navigate potential market fluctuations.