Technical Analysis of PKB 2024-05-10
Overview:
In analyzing the technical indicators for PKB stock over the last 5 days, we will delve into the trends, momentum, volatility, and volume aspects to provide a comprehensive outlook on the possible stock price movement in the coming days. By examining key indicators such as moving averages, MACD, RSI, Bollinger Bands, and OBV, we aim to offer valuable insights and predictions for potential investors.
Trend Analysis:
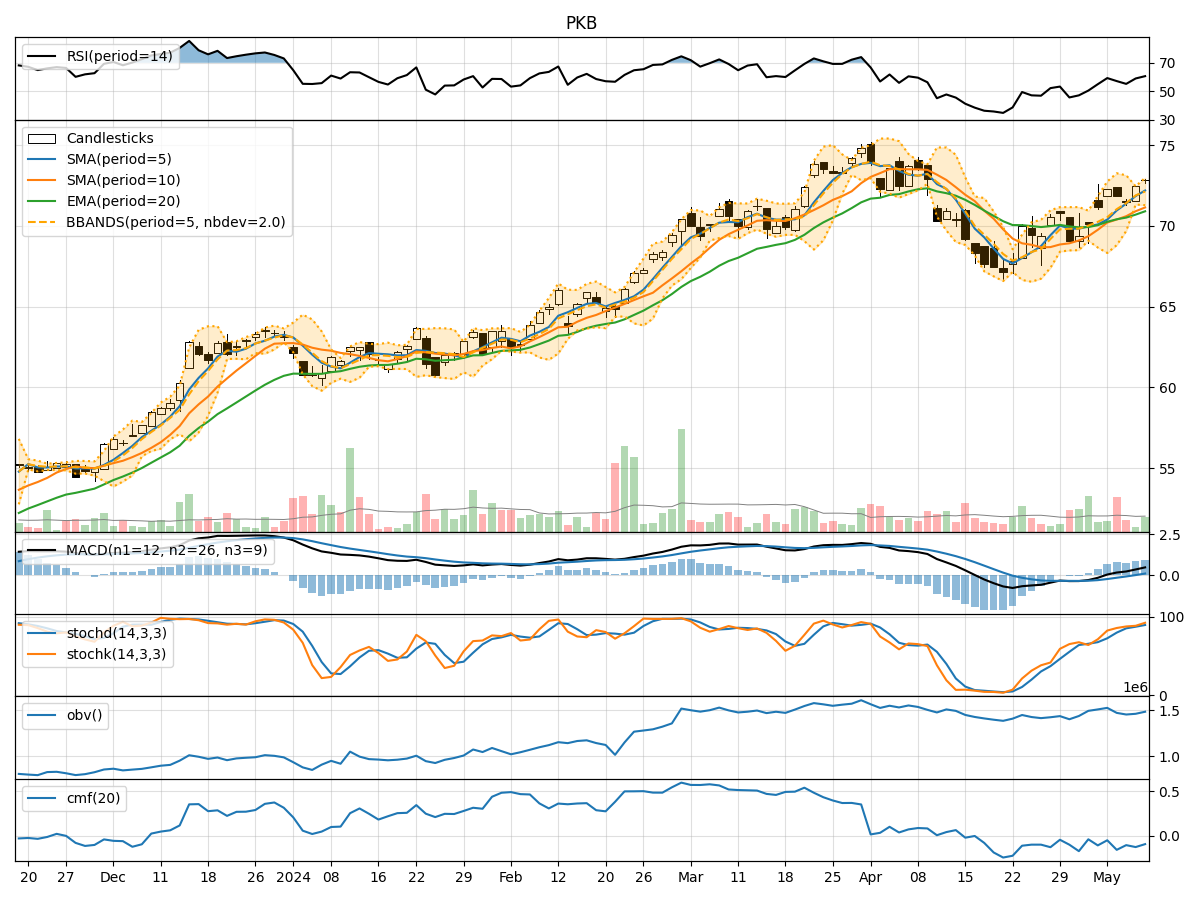
- Moving Averages (MA): The 5-day moving average has been consistently rising, indicating a bullish trend in the short term.
- MACD: The MACD line has been above the signal line for the past 5 days, suggesting a bullish momentum.
Momentum Analysis:
- RSI: The RSI has been fluctuating but generally staying above 50, indicating a bullish momentum.
- Stochastic Oscillator: Both %K and %D have been in the overbought zone, suggesting a strong bullish momentum.
Volatility Analysis:
- Bollinger Bands: The stock price has been trading within the upper Bollinger Band, indicating an overbought condition and potential for a reversal.
Volume Analysis:
- On-Balance Volume (OBV): The OBV has been fluctuating but not showing a clear trend, suggesting indecision in the market.
Key Observations:
- The stock is currently in a bullish trend based on moving averages and MACD.
- Momentum indicators like RSI and Stochastic Oscillator suggest a strong bullish sentiment.
- Volatility is high as the stock price is at the upper Bollinger Band, indicating a potential reversal.
- Volume indicators like OBV do not provide a clear direction, signaling uncertainty in market sentiment.
Conclusion:
Based on the analysis of technical indicators, the stock is likely to experience a short-term correction or consolidation due to the overbought condition indicated by the Bollinger Bands and the high Stochastic values. Investors should exercise caution and consider taking profits or waiting for a better entry point. The bullish trend may resume after a period of consolidation, so it is essential to monitor the price action closely in the coming days.