Technical Analysis of PLDR 2024-05-10
Overview:
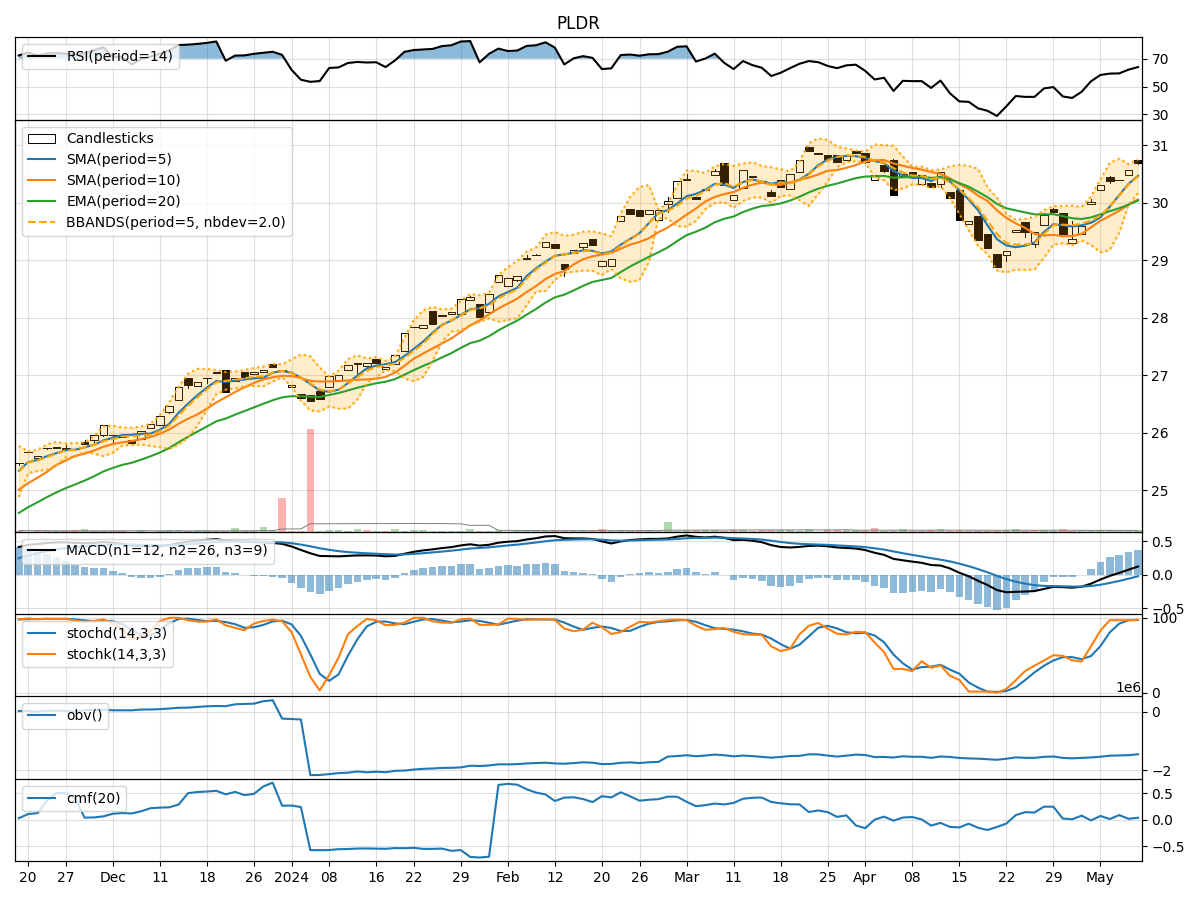
In analyzing the technical indicators for PLDR over the last 5 days, we will delve into the trend, momentum, volatility, and volume indicators to provide a comprehensive outlook on the possible stock price movement in the coming days.
Trend Analysis:
- Moving Averages (MA): The 5-day Moving Average (MA) has been consistently above the Simple Moving Average (SMA) and Exponential Moving Average (EMA), indicating a bullish trend.
- MACD: The MACD line has been consistently above the signal line, with both lines showing an upward trend, suggesting bullish momentum.
- RSI: The Relative Strength Index (RSI) has been increasing, indicating strengthening buying pressure.
Momentum Analysis:
- Stochastic Oscillator: Both %K and %D have been in the overbought zone, suggesting a potential reversal or consolidation.
- Williams %R: The Williams %R has been fluctuating around the oversold territory, indicating potential buying opportunities.
Volatility Analysis:
- Bollinger Bands: The stock price has been trading within the Bollinger Bands, with the bands narrowing, indicating decreasing volatility.
- Average True Range (ATR): The ATR has been relatively stable, suggesting consistent price movements.
Volume Analysis:
- On-Balance Volume (OBV): The OBV has been increasing, indicating accumulation by investors.
- Chaikin Money Flow (CMF): The CMF has been positive, suggesting buying pressure in the market.
Key Observations:
- The trend indicators suggest a strong bullish sentiment in the stock.
- Momentum indicators show signs of potential overbought conditions, indicating a possible correction or consolidation.
- Volatility has been decreasing, indicating a period of stability in price movements.
- Volume indicators point towards increasing accumulation and buying pressure.
Conclusion:
Based on the analysis of the technical indicators, the stock is likely to continue its upward trend in the short term. However, caution is advised as momentum indicators signal potential overbought conditions, which could lead to a temporary pullback or consolidation. Traders should closely monitor the price action and key support levels for any signs of reversal. Overall, the outlook remains bullish with a potential for a short-term correction before resuming the uptrend.