Technical Analysis of PMAY 2024-05-10
Overview:
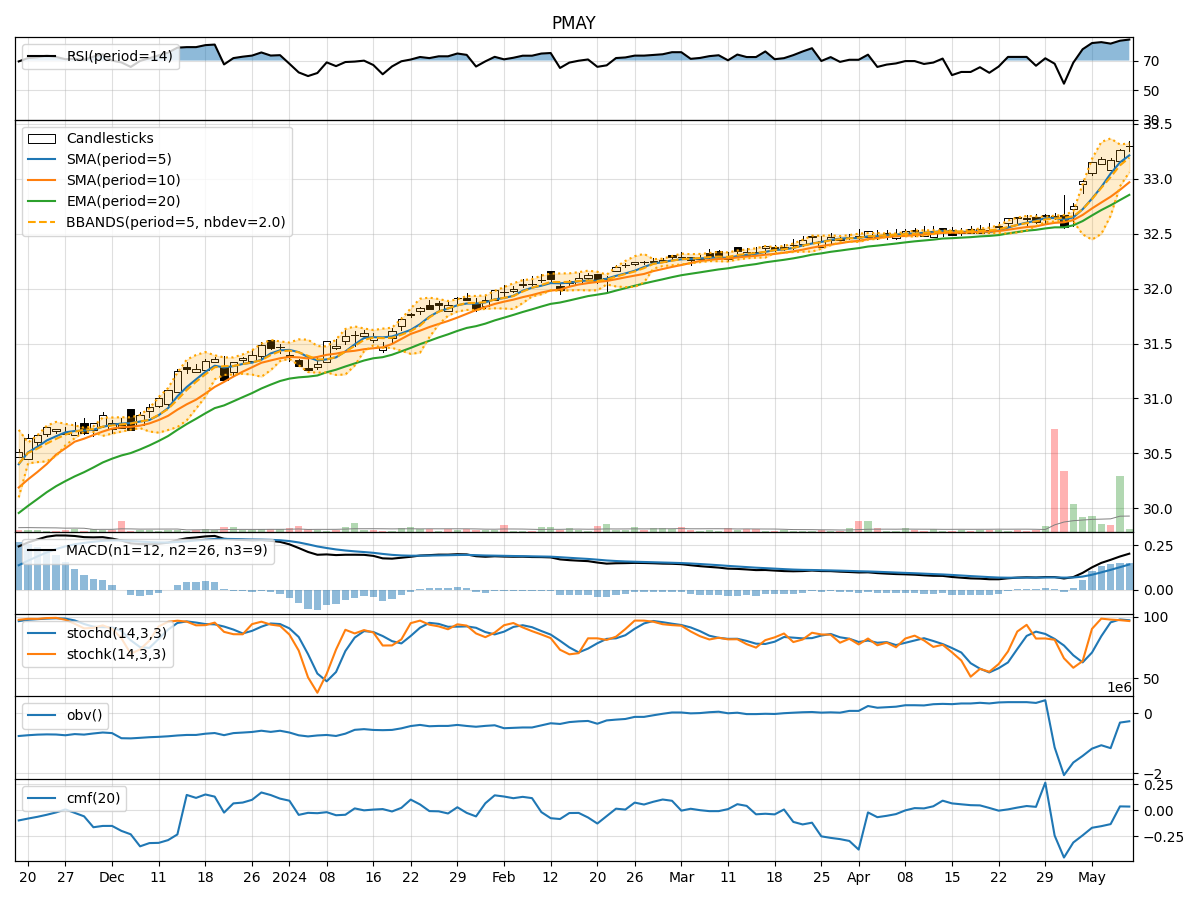
In the last 5 trading days, PMAY stock has shown a consistent uptrend in its price, supported by positive momentum and volatility indicators. The stock has also experienced increasing trading volume, indicating growing interest from market participants. However, it is essential to delve deeper into each technical indicator category to provide a comprehensive analysis and make informed predictions for the next few days.
Trend Indicators:
- Moving Averages (MA): The stock's closing price has been consistently above the 5-day moving average, indicating a short-term uptrend. Both the simple moving average (SMA) and exponential moving average (EMA) have been trending upwards, supporting the bullish momentum.
- Moving Average Convergence Divergence (MACD): The MACD line has been above the signal line for the past 5 days, suggesting a bullish trend. The MACD histogram has also been increasing, indicating strengthening bullish momentum.
Momentum Indicators:
- Relative Strength Index (RSI): The RSI has been consistently above 70, indicating overbought conditions. While this suggests a strong uptrend, it also raises concerns about a potential pullback or consolidation in the near future.
- Stochastic Oscillator: Both %K and %D lines of the stochastic oscillator have been in the overbought zone, signaling a strong bullish momentum. However, caution is advised as the stock may be due for a correction.
Volatility Indicators:
- Bollinger Bands (BB): The stock price has been trading within the upper Bollinger Band range, indicating an overbought condition. The narrowing of the bands suggests decreasing volatility, which could precede a period of consolidation or a reversal.
- Average True Range (ATR): The ATR has been relatively stable, indicating consistent price movements. However, a sudden increase in ATR could signal a potential shift in volatility.
Volume Indicators:
- On-Balance Volume (OBV): The OBV has shown a mixed trend, with some days experiencing selling pressure and others showing accumulation. This indicates indecision among market participants regarding the stock's future direction.
- Chaikin Money Flow (CMF): The CMF has been negative, suggesting that money may be flowing out of the stock. This could be a warning sign of weakening buying pressure.
Conclusion:
Based on the analysis of the technical indicators, the next few days for PMAY stock are likely to see a potential pullback or consolidation. While the uptrend has been strong, overbought conditions indicated by the RSI and stochastic oscillator raise concerns about a correction. The narrowing Bollinger Bands and negative CMF also suggest a possible period of consolidation. Traders should exercise caution and consider taking profits or implementing risk management strategies in anticipation of a potential downward movement in the stock price.