Technical Analysis of POCT 2024-05-10
Overview:
In analyzing the technical indicators for POCT stock over the last 5 days, we will delve into the trend, momentum, volatility, and volume indicators to provide a comprehensive outlook on the possible stock price movement in the coming days. By examining these key aspects, we aim to offer valuable insights and predictions to guide your investment decisions.
Trend Analysis:
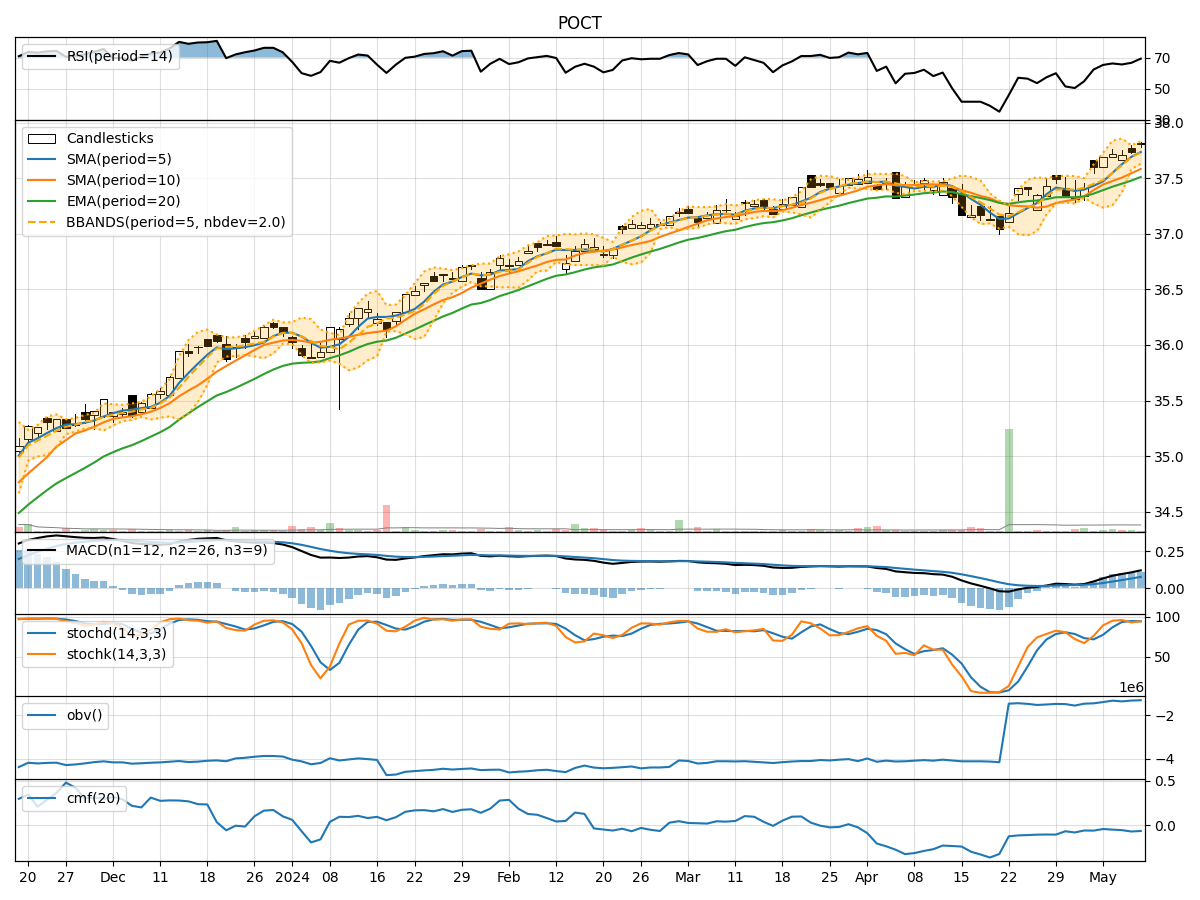
- Moving Averages (MA): The 5-day Moving Average (MA) has been consistently above the Simple Moving Average (SMA) and Exponential Moving Average (EMA), indicating a bullish trend.
- MACD: The MACD line has been consistently above the signal line, with both lines showing an upward trend, suggesting bullish momentum.
Momentum Analysis:
- RSI: The Relative Strength Index (RSI) has been in the overbought territory, indicating a strong bullish momentum.
- Stochastic Oscillator: Both %K and %D lines of the Stochastic Oscillator have been in the overbought zone, signaling a strong bullish momentum.
Volatility Analysis:
- Bollinger Bands (BB): The stock price has been trading within the upper Bollinger Band (BBU), suggesting an increased volatility but also potential overbought conditions.
Volume Analysis:
- On-Balance Volume (OBV): The OBV has been showing a slight decrease, indicating some distribution happening in the stock.
- Chaikin Money Flow (CMF): The CMF has been negative, suggesting a bearish pressure on the stock.
Key Observations:
- The trend indicators, momentum indicators, and volatility indicators all point towards a strong bullish sentiment in the stock.
- However, the volume indicators show a slight divergence with a bearish bias, indicating some caution.
Conclusion:
Based on the analysis of the technical indicators, the next few days' possible stock price movement for POCT is likely to be upward with a bullish bias. However, investors should be cautious of the potential divergence in volume indicators, which could lead to some consolidation or correction in the short term. Overall, the trend and momentum signals are strong, indicating a potential continuation of the bullish trend, but monitoring volume closely is advised to confirm the sustainability of the upward movement.