Technical Analysis of POWA 2024-05-10
Overview:
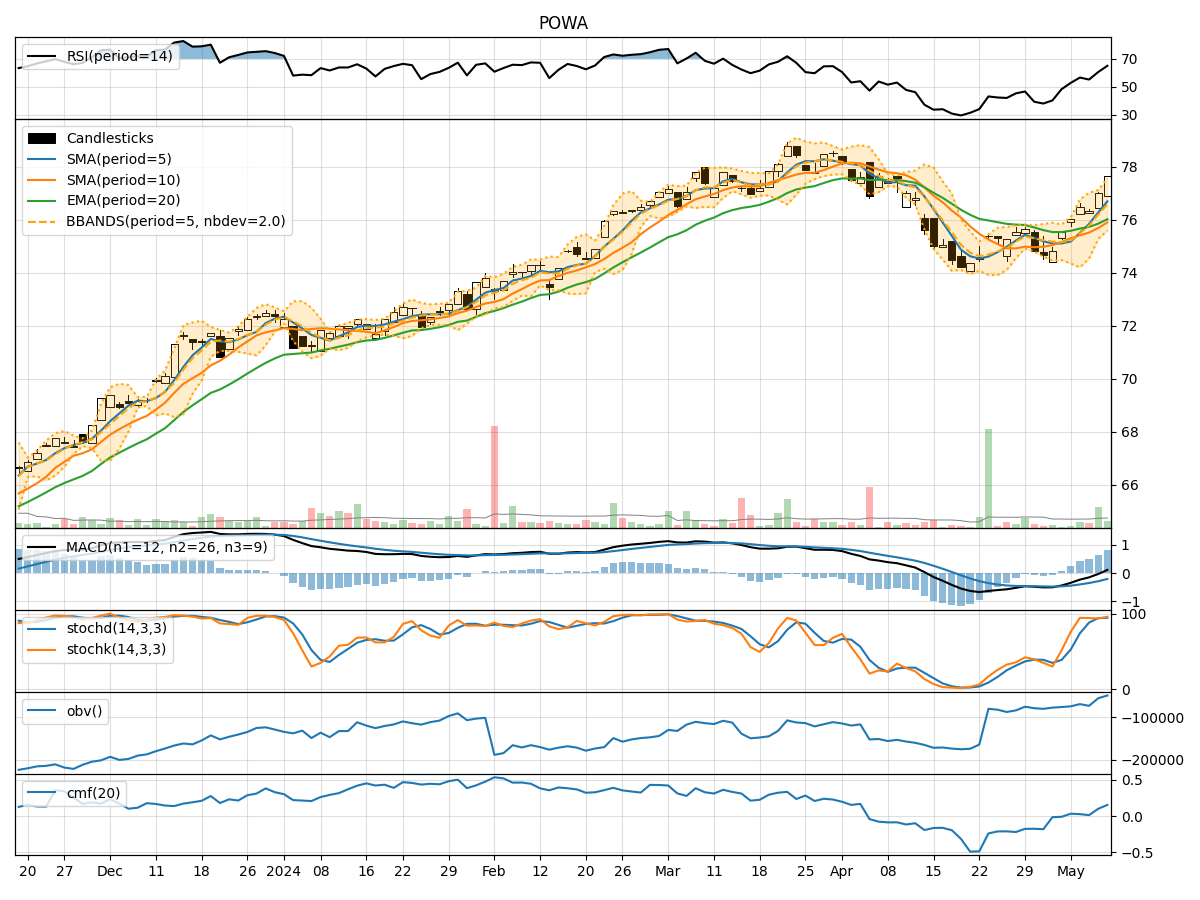
In analyzing the technical indicators for POWA over the last 5 days, we will delve into the trend, momentum, volatility, and volume indicators to provide a comprehensive outlook on the possible stock price movement in the coming days.
Trend Analysis:
- Moving Averages (MA): The 5-day Moving Average (MA) has been consistently rising, indicating a bullish trend in the short term.
- MACD: The MACD line has been above the signal line, suggesting a bullish momentum.
- EMA: The Exponential Moving Average (EMA) has also been trending upwards, supporting the bullish sentiment.
Momentum Analysis:
- RSI: The Relative Strength Index (RSI) has been increasing, indicating strengthening momentum.
- Stochastic Oscillator: Both %K and %D have been in the overbought zone, suggesting a potential reversal or consolidation.
- Williams %R: The Williams %R is close to the oversold territory, indicating a possible buying opportunity.
Volatility Analysis:
- Bollinger Bands: The stock price has been trading near the upper Bollinger Band, indicating high volatility and a potential overbought condition.
- Bollinger Band Width: The Band Width has been expanding, suggesting increased price volatility.
Volume Analysis:
- On-Balance Volume (OBV): The OBV has been steadily increasing, indicating strong buying pressure.
- Chaikin Money Flow (CMF): The CMF has been positive, reflecting buying interest in the stock.
Key Observations:
- The trend indicators suggest a bullish sentiment in the short term.
- Momentum indicators show a mix of overbought and oversold conditions, signaling a potential reversal or consolidation.
- Volatility indicators point towards high price volatility and a possible overbought scenario.
- Volume indicators indicate strong buying pressure and positive money flow into the stock.
Conclusion:
Based on the analysis of the technical indicators, the next few days' possible stock price movement for POWA is likely to be upward with a potential for consolidation or reversal in the short term due to the mixed signals from momentum indicators. Traders should closely monitor the stochastic oscillator for potential reversal signals and the Bollinger Bands for indications of overbought conditions. Overall, the bullish trend supported by strong buying pressure and positive money flow suggests a favorable outlook for the stock.