Technical Analysis of PP 2024-05-10
Overview:
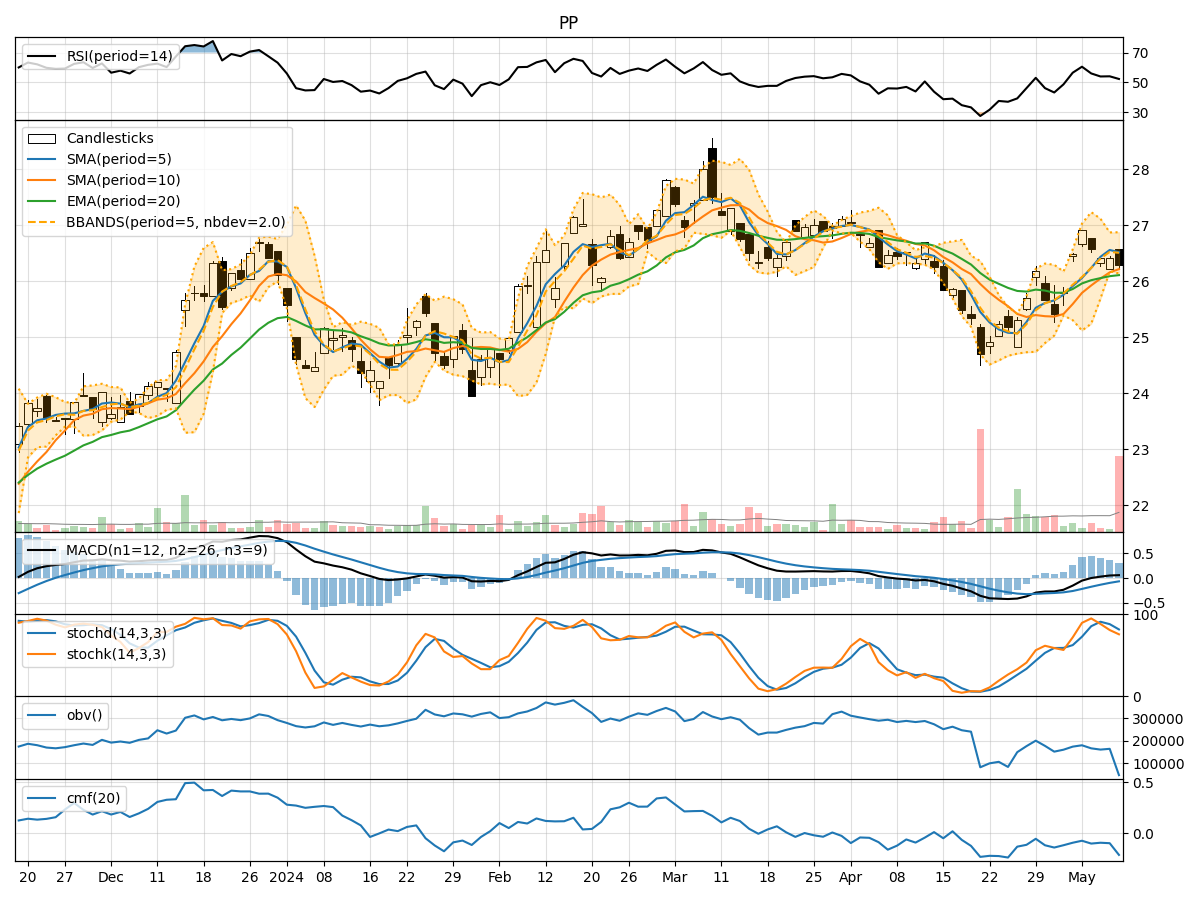
In analyzing the provided Technical Analysis (TA) data for the last 5 days, we will delve into the trend, momentum, volatility, and volume indicators to forecast the possible stock price movement for the next few days. By examining these key indicators, we aim to provide a comprehensive and insightful analysis to guide investment decisions.
Trend Indicators:
- Moving Averages (MA): The 5-day MA has been consistently above the closing prices, indicating a short-term uptrend.
- MACD: The MACD line has been above the signal line for the past 5 days, suggesting bullish momentum.
- EMA: The exponential moving average has been trending upwards, supporting the bullish sentiment.
Momentum Indicators:
- RSI: The Relative Strength Index has been fluctuating around the neutral zone, indicating indecision in the market.
- Stochastic Oscillator: Both %K and %D have been gradually decreasing, signaling a potential reversal in momentum.
- Williams %R: The indicator has been in oversold territory, suggesting a possible upcoming price correction.
Volatility Indicators:
- Bollinger Bands: The bands have been narrowing, indicating decreasing volatility and a potential breakout in the near future.
- Bollinger %B: The %B indicator has been hovering around the middle range, reflecting a balanced market sentiment.
Volume Indicators:
- On-Balance Volume (OBV): The OBV has been negative, indicating distribution and selling pressure in the market.
- Chaikin Money Flow (CMF): The CMF has been consistently negative, suggesting outflow of money from the stock.
Key Observations and Opinions:
- Trend: The trend indicators suggest a bullish bias in the short term.
- Momentum: Momentum indicators show mixed signals with a slight bearish bias.
- Volatility: Volatility indicators point towards a potential breakout in price.
- Volume: Volume indicators indicate selling pressure and a lack of buying interest.
Conclusion:
Based on the analysis of the technical indicators, the next few days' possible stock price movement is likely to be sideways with a slight bearish bias. The mixed signals from momentum indicators, coupled with negative volume indicators, suggest a period of consolidation or a minor pullback in the stock price. Traders should exercise caution and closely monitor key support and resistance levels for potential entry or exit points.
Disclaimer:
Remember that technical analysis is not a guaranteed predictor of future price movements, and other fundamental factors and market dynamics can influence stock prices. It is essential to consider multiple indicators and conduct thorough research before making any investment decisions. Consulting with a financial advisor can provide valuable insights tailored to your specific investment goals and risk tolerance level.