Technical Analysis of PPA 2024-05-10
Overview:
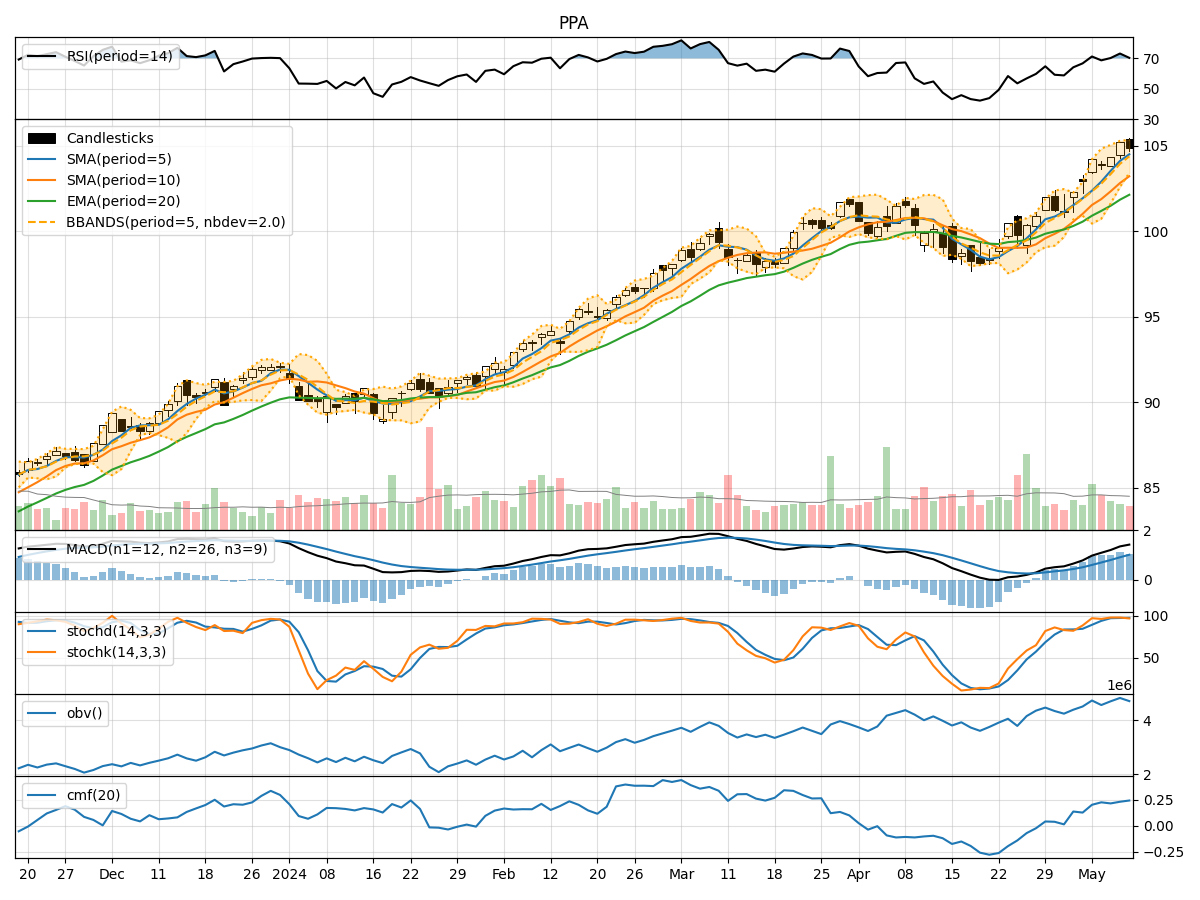
In analyzing the technical indicators for PPA stock over the last 5 days, we will delve into the trend, momentum, volatility, and volume indicators to provide a comprehensive outlook on the possible stock price movement in the coming days.
Trend Indicators:
- Moving Averages (MA): The 5-day MA has been consistently above the closing prices, indicating a bullish trend.
- MACD: The MACD line has been above the signal line, suggesting a bullish momentum.
- EMA: The EMA has been trending upwards, supporting the bullish sentiment.
Momentum Indicators:
- RSI: The RSI has been in the overbought territory, indicating a strong bullish momentum.
- Stochastic Oscillator: Both %K and %D have been in the overbought zone, signaling a potential reversal.
- Williams %R: The indicator has been in the oversold region, suggesting a possible bullish reversal.
Volatility Indicators:
- Bollinger Bands: The stock price has been trading within the bands, indicating a period of consolidation.
- Bollinger %B: The %B value has been fluctuating around 0.7, suggesting a neutral stance.
- Bollinger Band Width: The narrowing of the bands indicates decreasing volatility.
Volume Indicators:
- On-Balance Volume (OBV): The OBV has been showing a slight increase, indicating accumulation.
- Chaikin Money Flow (CMF): The CMF has been positive, suggesting buying pressure in the stock.
Key Observations:
- The trend indicators point towards a bullish sentiment with moving averages and MACD supporting an upward trend.
- Momentum indicators show conflicting signals with RSI in overbought territory but stochastic oscillators hinting at a potential reversal.
- Volatility indicators suggest a period of consolidation with decreasing volatility.
- Volume indicators indicate a slight increase in buying pressure but not significant enough to drive a strong uptrend.
Conclusion:
Based on the analysis of the technical indicators, the stock price of PPA is likely to experience a period of consolidation in the coming days. The conflicting signals from momentum indicators and the lack of significant volume support suggest a sideways movement. Traders should exercise caution and wait for clearer signals before taking any significant positions.