Technical Analysis of PPEM 2024-05-10
Overview:
In analyzing the provided technical indicators for the stock with the ticker symbol PPEM over the last 5 days, we will delve into the trend, momentum, volatility, and volume indicators to determine the possible future stock price movement. By examining these key aspects, we aim to provide a comprehensive and insightful prediction for the upcoming days.
Trend Indicators:
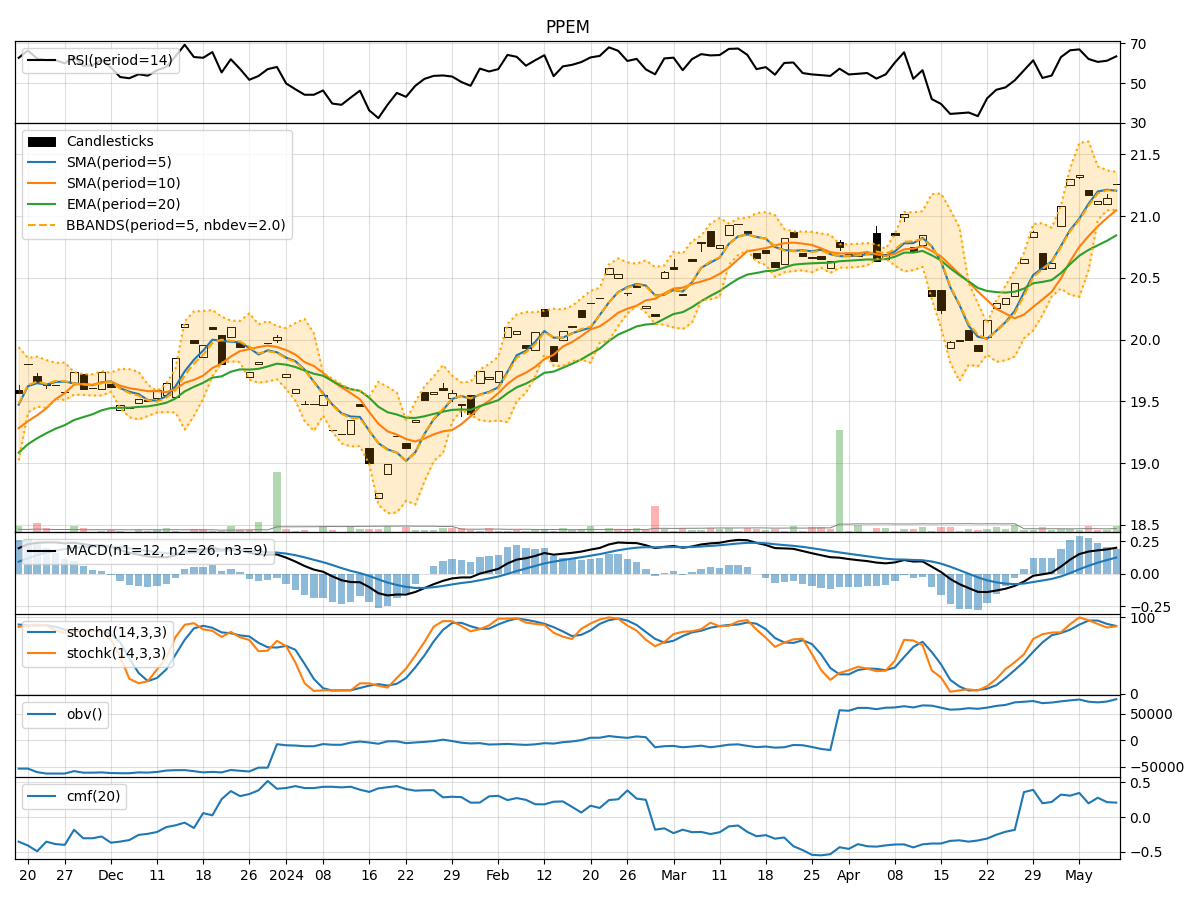
- Moving Averages (MA): The 5-day Moving Average has been consistently above the Simple Moving Average (SMA) and Exponential Moving Average (EMA), indicating a bullish trend.
- MACD: The MACD line has been above the signal line for the past 5 days, with both lines showing an upward trend, suggesting bullish momentum.
- MACD Histogram: The MACD Histogram has been increasing over the last 5 days, indicating strengthening bullish momentum.
Momentum Indicators:
- RSI: The Relative Strength Index (RSI) has been fluctuating around the 60-65 range, suggesting a neutral momentum without being overbought or oversold.
- Stochastic Oscillator: Both %K and %D lines of the Stochastic Oscillator have been moving within the neutral zone, indicating a lack of strong momentum in either direction.
Volatility Indicators:
- Bollinger Bands (BB): The stock price has been trading within the Bollinger Bands, with the bands narrowing slightly over the last 5 days, indicating decreasing volatility.
- Bollinger %B: The %B indicator has been hovering around 0.5, suggesting the stock is trading at the middle of the Bollinger Bands.
Volume Indicators:
- On-Balance Volume (OBV): The OBV has shown a slight increase over the last 5 days, indicating a potential accumulation of the stock.
- Chaikin Money Flow (CMF): The CMF has been fluctuating around 0.2, suggesting a neutral money flow into the stock.
Conclusion:
Based on the analysis of the technical indicators, the stock of PPEM is currently exhibiting a bullish trend with strong momentum and decreasing volatility. The neutral momentum indicators imply a lack of significant buying or selling pressure at the moment. Considering the overall picture, the stock is likely to continue its upward trajectory in the next few days. Investors may consider holding onto their positions or even consider adding to them based on the bullish outlook provided by the technical analysis.