Technical Analysis of PPI 2024-05-10
Overview:
In analyzing the provided Technical Analysis (TA) data for the last 5 days, we will delve into the trend, momentum, volatility, and volume indicators to forecast the possible stock price movement for the next few days. By examining these key indicators, we aim to provide a comprehensive and insightful prediction backed by data-driven analysis.
Trend Analysis:
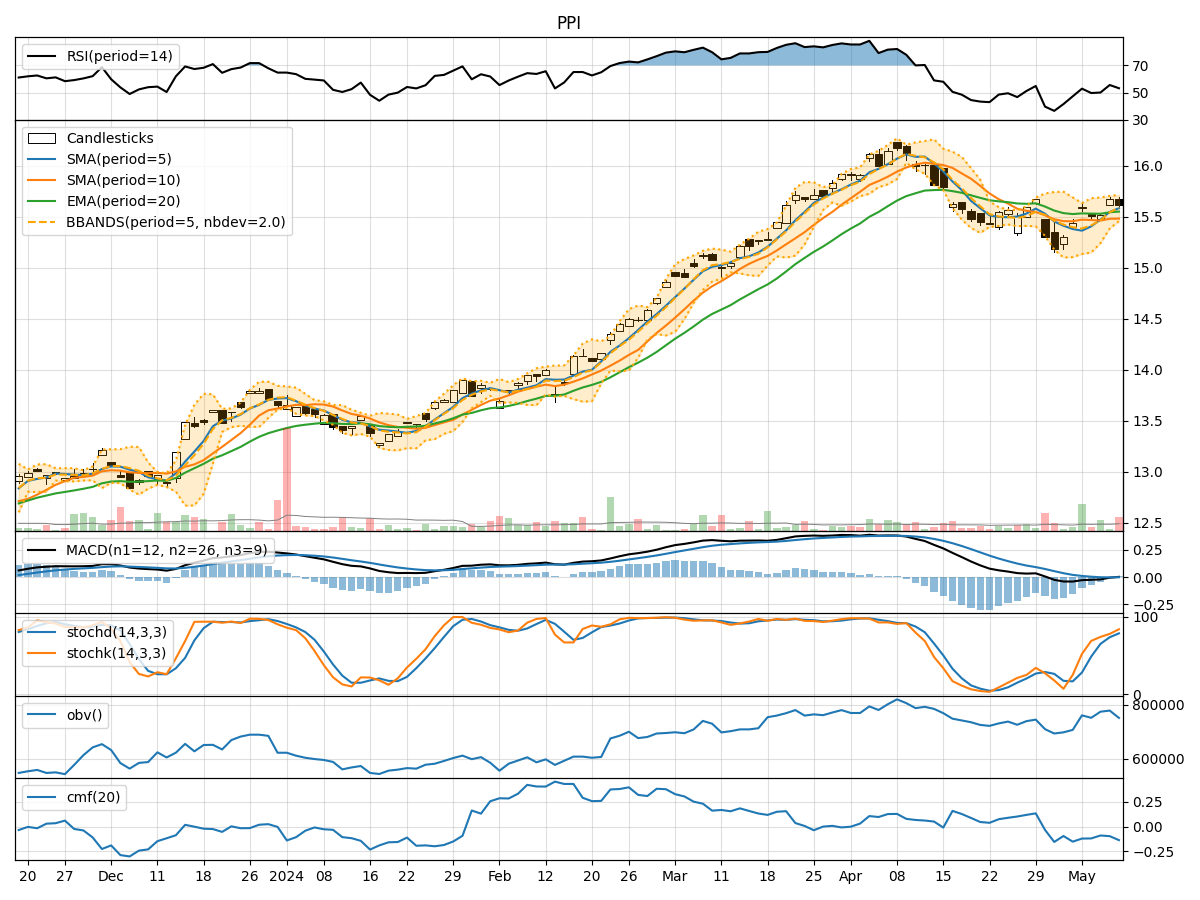
- Moving Averages (MA): The 5-day Moving Average (MA) has been gradually increasing, indicating a positive trend in the stock price.
- MACD: The Moving Average Convergence Divergence (MACD) has been showing a slight uptrend, with the MACD line crossing above the signal line on the last day, suggesting a potential bullish momentum.
- EMA: The Exponential Moving Average (EMA) has been relatively stable, reflecting a consistent price trend.
Momentum Analysis:
- RSI: The Relative Strength Index (RSI) has been fluctuating around the neutral zone, indicating a balanced momentum without extreme overbought or oversold conditions.
- Stochastic Oscillator: Both %K and %D lines of the Stochastic Oscillator have been rising, suggesting increasing buying pressure and potential upward momentum.
- Williams %R: The Williams %R indicator has been hovering in the oversold territory, indicating a possible reversal in the short term.
Volatility Analysis:
- Bollinger Bands (BB): The Bollinger Bands have been narrowing, indicating decreasing volatility and a potential price breakout in the near future.
- BB %B: The %B indicator has been relatively low, suggesting a possible consolidation phase before a significant price movement.
- Average True Range (ATR): The ATR has been decreasing, signaling a reduction in price volatility.
Volume Analysis:
- On-Balance Volume (OBV): The OBV indicator has been fluctuating, reflecting mixed buying and selling pressure in the market.
- Chaikin Money Flow (CMF): The CMF has been negative, indicating a lack of strong buying interest in the stock.
Conclusion:
Based on the analysis of the trend, momentum, volatility, and volume indicators, the stock is likely to experience sideways consolidation in the next few days. The upward trend in moving averages and MACD, coupled with the positive momentum from the Stochastic Oscillator, may support a potential bullish bias. However, the lackluster volume activity and low CMF values suggest a cautious approach.
In summary, while there are indications of a possible upward movement in the stock price, the overall market sentiment appears to be neutral with a slight bullish bias. Traders and investors should closely monitor key levels and wait for confirmation signals before making any significant trading decisions.