Technical Analysis of PPIE 2024-05-10
Overview:
In analyzing the technical indicators for PPIE stock over the last 5 days, we will delve into the trends, momentum, volatility, and volume indicators to provide a comprehensive outlook on the possible stock price movement in the coming days. By examining these key aspects, we aim to offer valuable insights and recommendations for your investment decisions.
Trend Indicators:
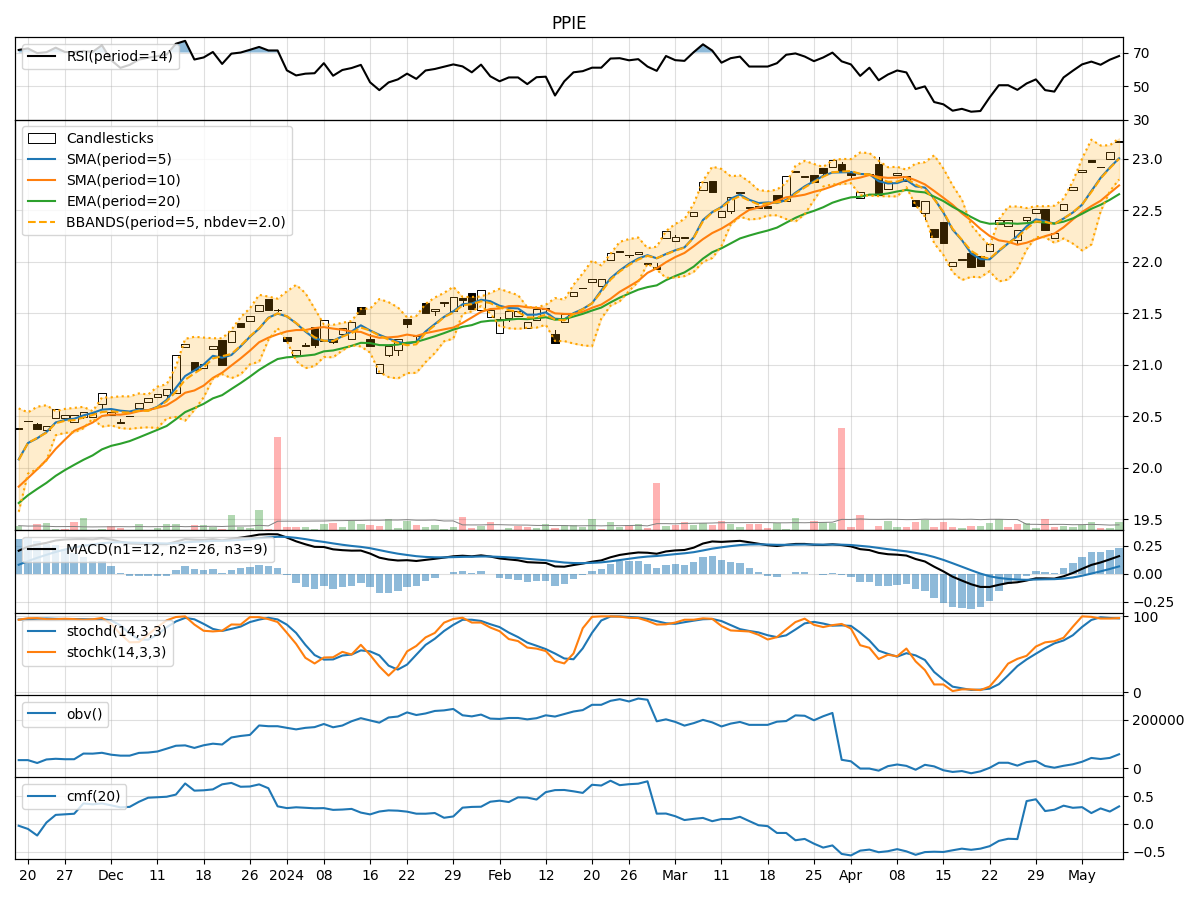
- Moving Averages (MA): The 5-day MA has been consistently above the 10-day SMA, indicating a short-term bullish trend.
- MACD: The MACD line has been consistently above the signal line, suggesting positive momentum.
- EMA: The EMA has been trending upwards, reflecting a bullish sentiment in the stock.
Momentum Indicators:
- RSI: The RSI has been in the overbought territory, indicating a strong bullish momentum.
- Stochastic Oscillator: Both %K and %D have been high, suggesting an overbought condition.
- Williams %R: The indicator has been hovering around the oversold region, signaling a potential reversal.
Volatility Indicators:
- Bollinger Bands: The stock price has been trading within the bands, indicating a period of consolidation.
- Bollinger %B: The %B value has been fluctuating around the midline, suggesting a lack of clear direction.
- Average True Range (ATR): The ATR has been relatively stable, indicating consistent volatility levels.
Volume Indicators:
- On-Balance Volume (OBV): The OBV has shown a slight decrease, suggesting some distribution in the stock.
- Chaikin Money Flow (CMF): The CMF has been positive, indicating buying pressure in the stock.
Key Observations:
- The trend indicators point towards a bullish sentiment in the stock, supported by the moving averages and MACD.
- Momentum indicators suggest a strong bullish momentum, although there are signs of potential overbought conditions.
- Volatility indicators indicate a period of consolidation with stable volatility levels.
- Volume indicators show a slight decrease in OBV but overall positive buying pressure indicated by CMF.
Conclusion:
Based on the analysis of the technical indicators, the stock is likely to continue its upward trend in the coming days. However, caution is advised as some momentum indicators suggest potential overbought conditions. The stock may experience some consolidation before potentially resuming its bullish trajectory. Overall, the outlook for PPIE stock is bullish with a potential for a short-term consolidation phase.