Technical Analysis of PPTY 2024-05-10
Overview:
In analyzing the technical indicators for PPTY over the last 5 days, we will delve into the trend, momentum, volatility, and volume indicators to provide a comprehensive outlook on the possible stock price movement in the coming days. By examining these key aspects, we aim to offer valuable insights and predictions to guide your investment decisions.
Trend Indicators:
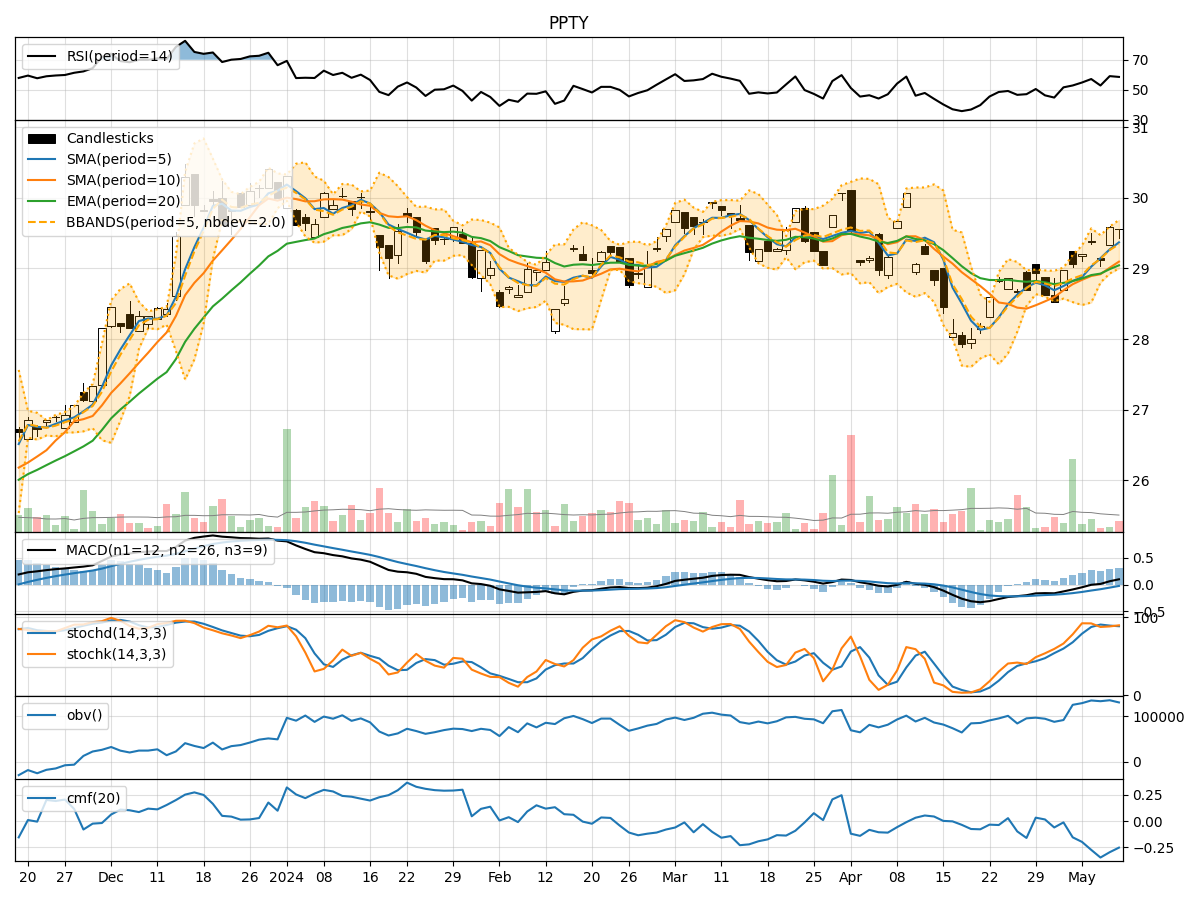
- Moving Averages (MA): The 5-day MA has been consistently above the closing prices, indicating a short-term uptrend.
- MACD: The MACD line has been positive and increasing, suggesting bullish momentum.
- MACD Histogram: The histogram has been rising, indicating strengthening bullish momentum.
Key Observation: The trend indicators point towards a bullish sentiment in the stock price movement.
Momentum Indicators:
- RSI: The RSI has been fluctuating around the 50 level, indicating a neutral momentum.
- Stochastic Oscillator: Both %K and %D have been hovering in the overbought territory, suggesting potential overvaluation.
- Williams %R: The indicator has been oscillating near the oversold region, signaling a potential reversal.
Key Observation: The momentum indicators reflect a mixed sentiment with a slight bearish bias.
Volatility Indicators:
- Bollinger Bands: The stock price has been trading within the bands, indicating normal volatility.
- Bollinger %B: The %B has been fluctuating around 0.5, suggesting equilibrium between volatility and price movement.
Key Observation: Volatility indicators suggest a sideways movement with no significant deviation from the mean.
Volume Indicators:
- On-Balance Volume (OBV): The OBV has been relatively stable, indicating a balance between buying and selling pressure.
- Chaikin Money Flow (CMF): The CMF has been negative, signaling outflows and potential selling pressure.
Key Observation: Volume indicators imply a neutral stance with a slight bearish inclination.
Conclusion:
Based on the analysis of trend, momentum, volatility, and volume indicators, the overall outlook for PPTY in the next few days is as follows: - Trend: Upward - Momentum: Mixed with a Bearish Bias - Volatility: Sideways - Volume: Neutral with a Bearish Inclination
Final Verdict:
Considering the collective analysis of the technical indicators, the next few days for PPTY are likely to see upward price movement with mixed momentum and sideways volatility. However, caution is advised due to the potential overbought conditions indicated by the momentum indicators. Investors should closely monitor price action and key support/resistance levels for timely decision-making.