Technical Analysis of PQDI 2024-05-10
Overview:
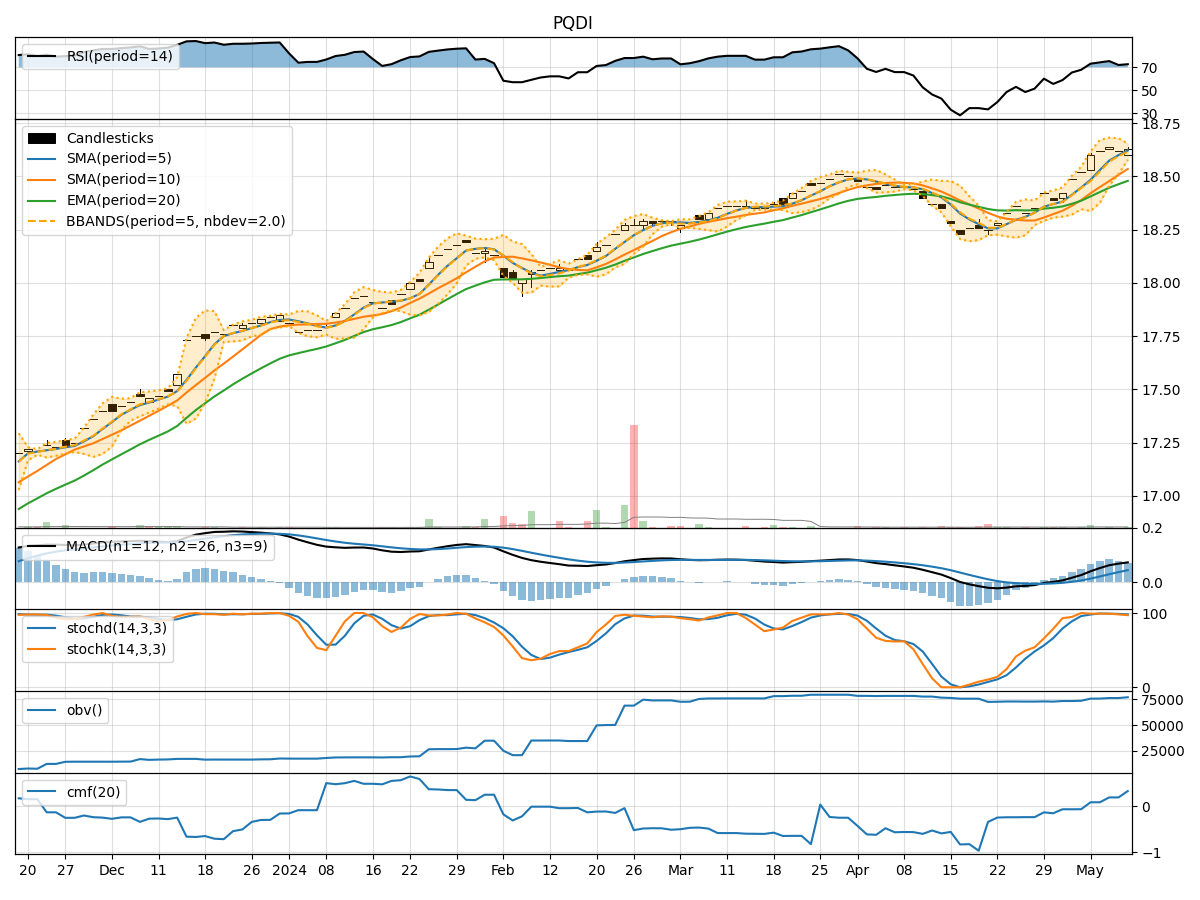
In the last 5 trading days, the stock price of PQDI has shown a slight upward trend with increasing volume. The trend indicators suggest a positive momentum, supported by the momentum indicators showing strength in the price movement. Volatility indicators indicate a narrowing of the Bollinger Bands, potentially signaling a period of consolidation. Volume indicators also show a positive trend in the On-Balance Volume (OBV) and Chaikin Money Flow (CMF).
Trend Indicators Analysis:
- Moving Averages (MA): The 5-day Moving Average has been consistently above the Simple Moving Average (SMA) and Exponential Moving Average (EMA), indicating a bullish trend.
- MACD: The MACD line has been above the signal line, with both lines showing an upward trajectory, indicating a bullish momentum.
- Conclusion: Upward trend is likely to continue in the next few days.
Momentum Indicators Analysis:
- RSI: The Relative Strength Index (RSI) has been in the overbought territory but has not shown signs of divergence, suggesting continued strength in the price movement.
- Stochastic Oscillator: Both %K and %D lines are in the overbought zone, indicating strong buying momentum.
- Williams %R: The Williams %R is also in the oversold region, suggesting a potential reversal.
- Conclusion: Bullish momentum is expected to persist in the near term.
Volatility Indicators Analysis:
- Bollinger Bands (BB): The bands have been narrowing, indicating decreasing volatility and a potential period of consolidation.
- Conclusion: The stock is likely to experience a period of sideways movement or consolidation in the coming days.
Volume Indicators Analysis:
- On-Balance Volume (OBV): The OBV has been steadily increasing, reflecting strong buying pressure.
- Chaikin Money Flow (CMF): The CMF has also been on the rise, indicating accumulation of the stock.
- Conclusion: Bullish sentiment is prevalent based on volume indicators.
Conclusion:
Considering the overall analysis of the technical indicators, the next few days for PQDI stock are likely to see a continuation of the upward trend supported by bullish momentum and positive volume indicators. However, the narrowing Bollinger Bands suggest a potential consolidation phase in the near future. Traders and investors should monitor the price action closely for any signs of a breakout or reversal.