Technical Analysis of PRAE 2024-05-10
Overview:
In analyzing the technical indicators for PRAE over the last 5 days, we will delve into the trend, momentum, volatility, and volume indicators to provide a comprehensive outlook on the possible stock price movement in the coming days. By examining these key indicators, we aim to offer valuable insights and predictions for informed decision-making.
Trend Indicators:
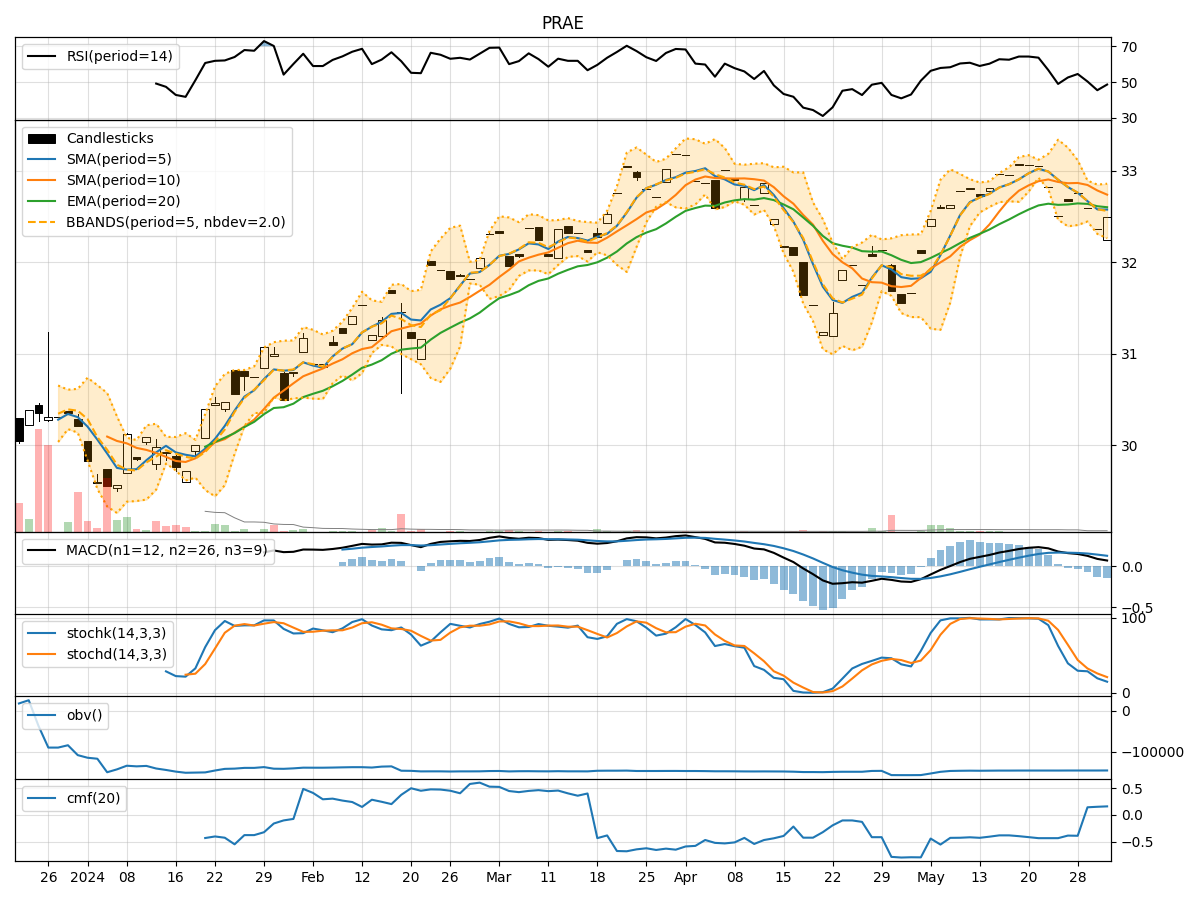
- Moving Averages (MA): The 5-day Moving Average (MA) has been consistently above the Simple Moving Average (SMA) and Exponential Moving Average (EMA), indicating a bullish trend.
- MACD: The MACD line has been consistently above the signal line, with the MACD histogram showing an increasing positive trend, suggesting bullish momentum.
Momentum Indicators:
- RSI: The Relative Strength Index (RSI) has been trending upwards, indicating increasing buying pressure.
- Stochastic Oscillator: Both %K and %D have been consistently high, suggesting strong bullish momentum.
Volatility Indicators:
- Bollinger Bands (BB): The stock price has been trading within the upper Bollinger Band (BBU), indicating high volatility.
Volume Indicators:
- On-Balance Volume (OBV): The OBV has been negative, suggesting distribution of the stock.
- Chaikin Money Flow (CMF): The CMF has been consistently negative, indicating selling pressure.
Key Observations and Opinions:
- Trend: The trend indicators suggest a strong bullish sentiment in the market.
- Momentum: Momentum indicators reflect increasing buying pressure and strong bullish momentum.
- Volatility: High volatility as indicated by the Bollinger Bands may lead to significant price swings.
- Volume: The negative OBV and CMF signal selling pressure and potential downward movement.
Conclusion:
Based on the analysis of the technical indicators, the next few days' possible stock price movement for PRAE is likely to experience a downward correction. Despite the bullish trend and momentum, the high volatility and negative volume indicators suggest a potential reversal or consolidation phase. Traders and investors should exercise caution and consider implementing risk management strategies in anticipation of a possible price decline.