Technical Analysis of PRAY 2024-05-10
Overview:
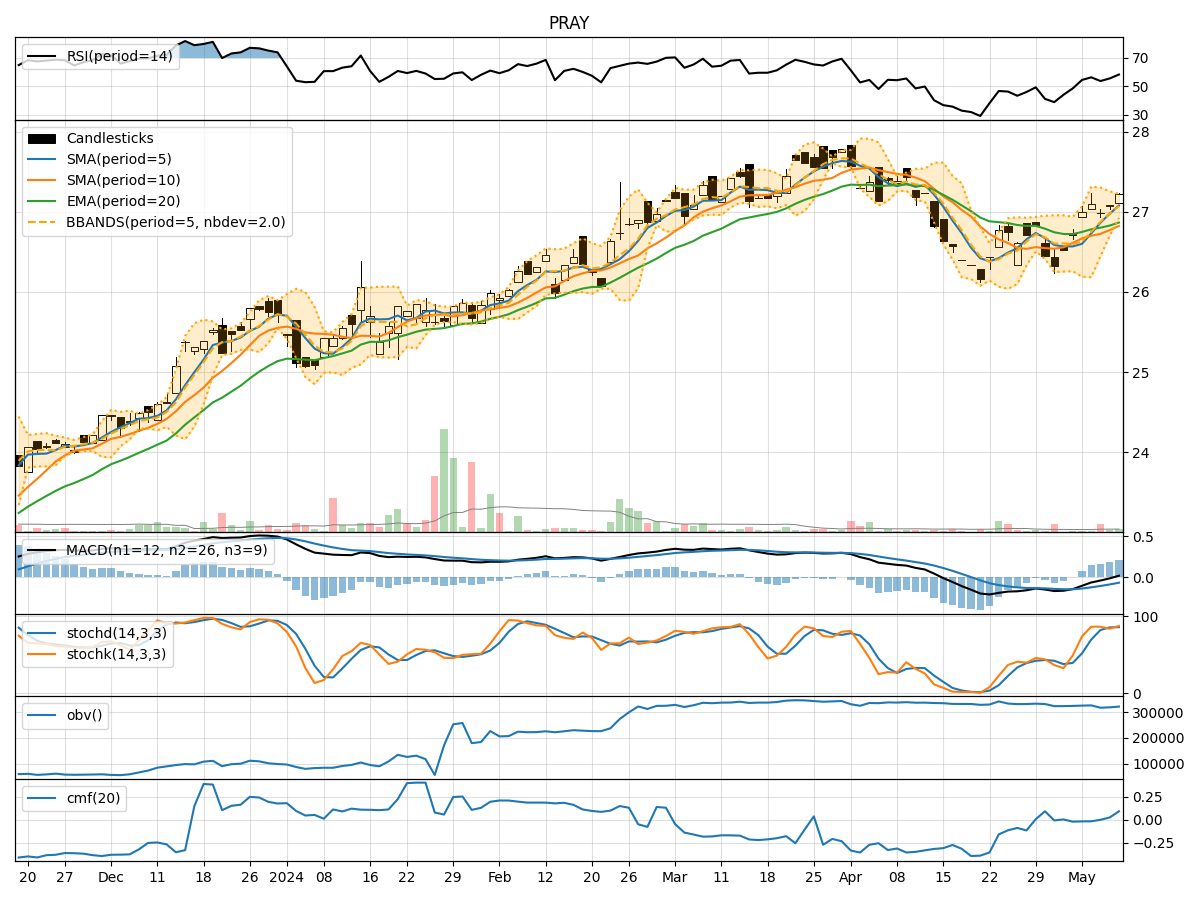
In analyzing the technical indicators for PRAY stock over the last 5 days, we will delve into the trends, momentum, volatility, and volume indicators to provide a comprehensive outlook on the possible stock price movement in the coming days.
Trend Analysis:
- Moving Averages (MA): The 5-day Moving Average (MA) has been consistently rising, indicating a bullish trend in the short term.
- MACD: The Moving Average Convergence Divergence (MACD) has been positive, with the MACD line above the signal line, suggesting bullish momentum.
- EMA: The Exponential Moving Average (EMA) has also been trending upwards, supporting the bullish sentiment.
Momentum Analysis:
- RSI: The Relative Strength Index (RSI) has been increasing, showing strengthening momentum.
- Stochastic Oscillator: Both %K and %D have been in the overbought zone, indicating a potential reversal or consolidation.
- Williams %R: The Williams %R is near oversold levels, suggesting a possible buying opportunity.
Volatility Analysis:
- Bollinger Bands: The stock price has been trading within the Bollinger Bands, with the bands narrowing, indicating reduced volatility.
- Bollinger %B: The %B indicator is close to 1, suggesting the stock is trading near the upper band.
Volume Analysis:
- On-Balance Volume (OBV): The OBV has been increasing, indicating accumulation by investors.
- Chaikin Money Flow (CMF): The CMF has been positive, reflecting buying pressure in the stock.
Key Observations:
- Trend: The stock is in an upward trend supported by moving averages and MACD.
- Momentum: Momentum indicators suggest overbought conditions, potentially leading to a short-term correction.
- Volatility: Volatility has been decreasing, indicating consolidation in the stock price.
- Volume: Increasing OBV and positive CMF signal bullish sentiment among investors.
Conclusion:
Based on the analysis of technical indicators, the next few days' possible stock price movement for PRAY is likely to be sideways to slightly bullish. While the trend remains positive, the overbought momentum signals and narrowing volatility suggest a potential period of consolidation or a minor pullback before a potential continuation of the uptrend. Investors should monitor key support and resistance levels for potential entry or exit points.