Technical Analysis of PRF 2024-05-10
Overview:
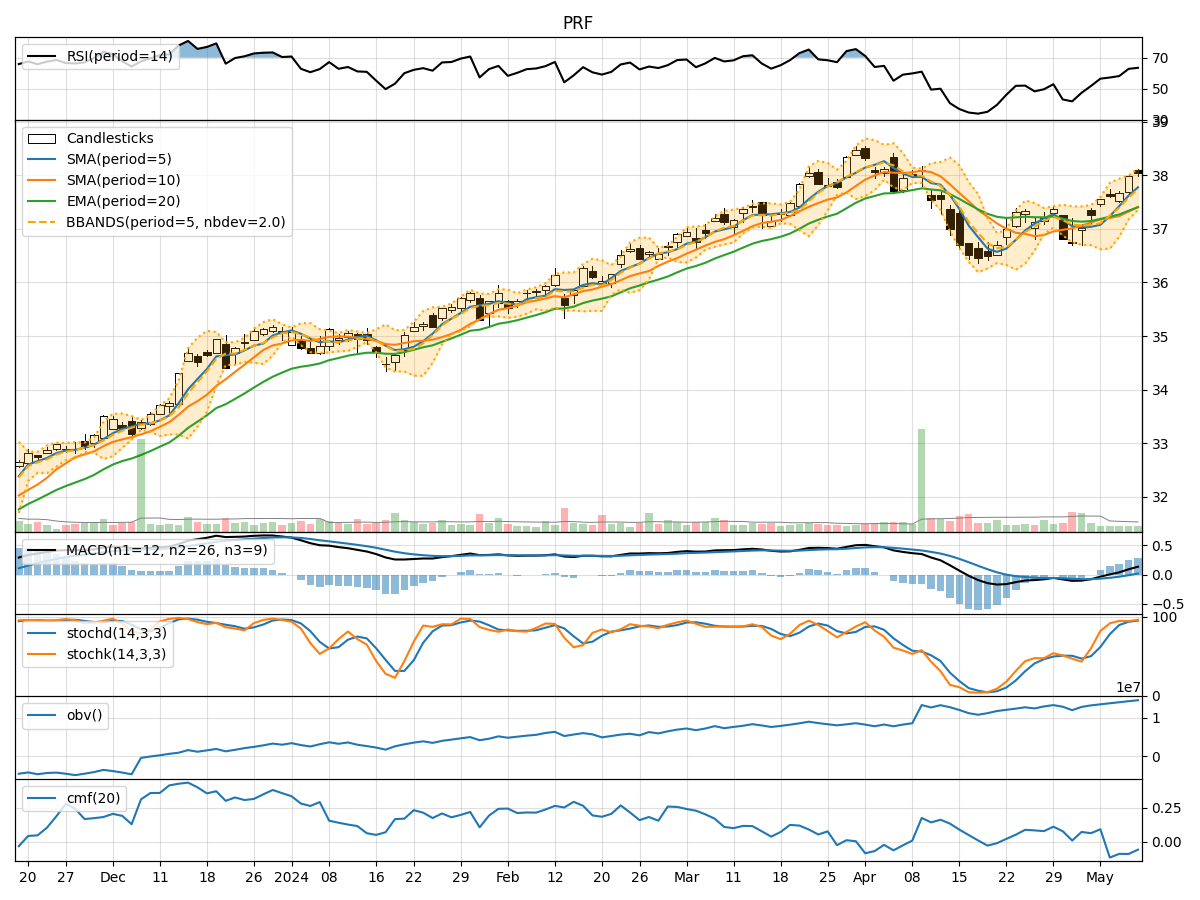
In the last 5 trading days, PRF stock has shown a consistent uptrend in both price and volume. The moving averages have been trending upwards, indicating a bullish sentiment. Momentum indicators like RSI and Stochastic oscillators suggest the stock is in overbought territory but still has room for potential upside. Volatility indicators show a narrowing of the Bollinger Bands, indicating a potential decrease in volatility. Volume indicators like OBV and CMF suggest a mixed sentiment with a slight negative bias.
Trend Indicators Analysis:
- Moving Averages (MA): The 5-day MA has been consistently above the longer-term SMAs, indicating a bullish trend.
- MACD: The MACD line has been above the signal line, indicating bullish momentum.
- MACD Histogram: The histogram has been increasing, showing strengthening bullish momentum.
Momentum Indicators Analysis:
- RSI: The RSI has been in overbought territory, suggesting a potential pullback or consolidation.
- Stochastic Oscillators: Both %K and %D have been in the overbought zone, indicating a potential reversal.
- Williams %R: The indicator has been in oversold territory, suggesting a potential reversal to the upside.
Volatility Indicators Analysis:
- Bollinger Bands: The bands have been narrowing, indicating decreasing volatility and a potential consolidation phase.
- Bollinger %B: The %B is above 0.5, suggesting the stock is trading above the middle band.
Volume Indicators Analysis:
- On-Balance Volume (OBV): The OBV has been slightly declining, indicating some distribution happening.
- Chaikin Money Flow (CMF): The CMF has been negative, suggesting a slight bearish sentiment in the stock.
Key Observations:
- The stock is currently in a strong uptrend based on moving averages and MACD.
- Momentum indicators suggest a potential pullback or consolidation due to overbought conditions.
- Volatility is decreasing, indicating a potential period of consolidation.
- Volume indicators show a mixed sentiment with a slight negative bias.
Conclusion:
Based on the technical indicators and analysis: - Short-Term: The stock may experience a slight pullback or consolidation in the next few days due to overbought conditions indicated by momentum indicators. - Medium-Term: The overall trend remains bullish, and any pullback could present a buying opportunity for investors looking to enter or add to their positions. - Long-Term: The stock's long-term outlook remains positive, but investors should monitor the momentum indicators for potential signs of a trend reversal.
Recommendation:
- Short-Term: Consider taking profits or waiting for a better entry point during the potential pullback.
- Medium-Term: Hold onto existing positions or consider adding to them during the consolidation phase.
- Long-Term: Maintain a bullish bias but stay vigilant for any signs of a trend reversal in the future.
Overall Assessment:
The stock is currently in a strong uptrend but may experience a short-term pullback or consolidation. Investors should use this opportunity to reassess their positions and consider their risk tolerance before making any decisions.