Technical Analysis of PRFD 2024-05-10
Overview:
In analyzing the technical indicators for PRFD over the last 5 days, we will delve into the trend, momentum, volatility, and volume indicators to provide a comprehensive outlook on the possible stock price movement. By examining these key aspects, we aim to offer valuable insights and predictions for the upcoming days.
Trend Indicators:
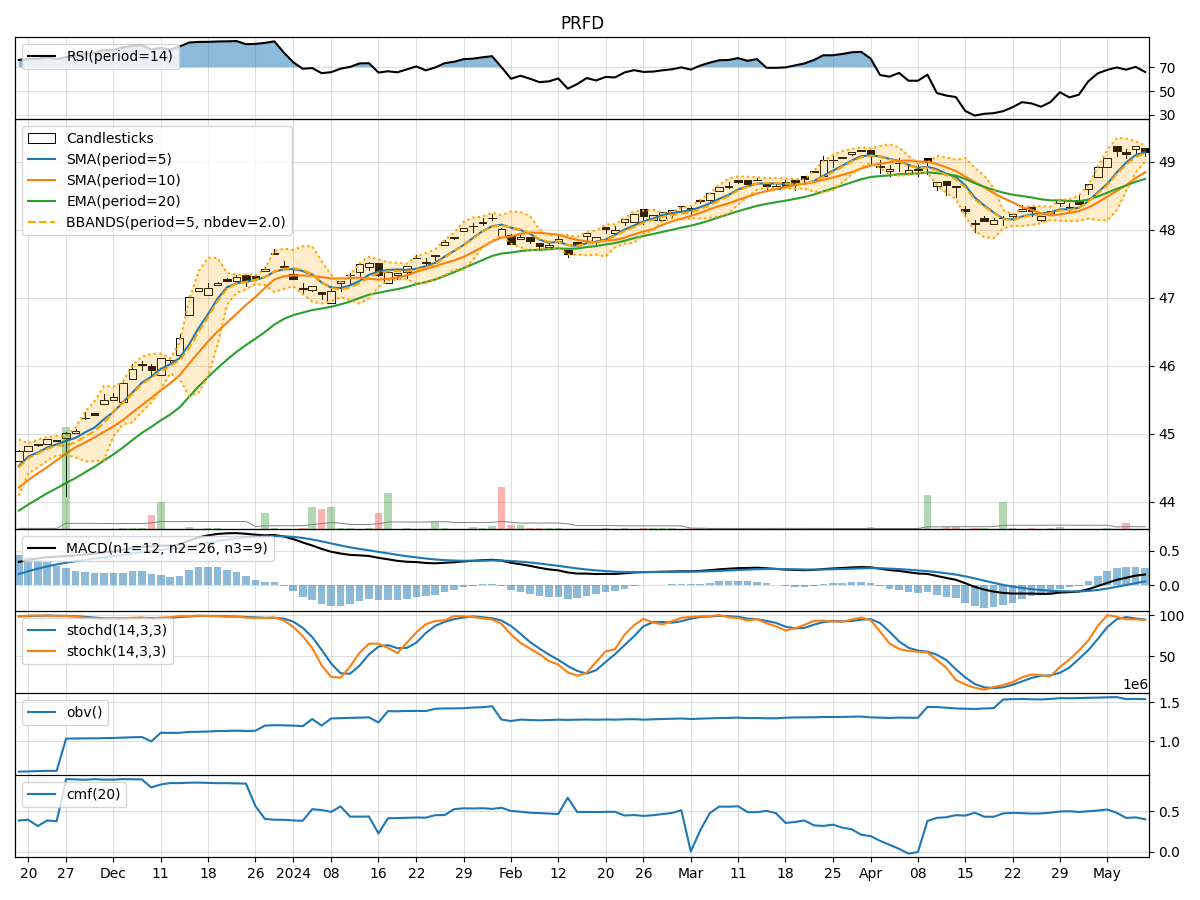
- Moving Averages (MA): The 5-day Moving Average (MA) has been consistently above the Simple Moving Average (SMA) and Exponential Moving Average (EMA), indicating a bullish trend.
- MACD: The MACD line has been consistently above the signal line, with both lines showing an upward trend, suggesting bullish momentum.
- MACD Histogram: The MACD Histogram has been increasing over the past 5 days, indicating strengthening bullish momentum.
Momentum Indicators:
- RSI: The Relative Strength Index (RSI) has been fluctuating around the overbought territory, suggesting a strong bullish momentum.
- Stochastic Oscillator: Both %K and %D lines of the Stochastic Oscillator have been in the overbought zone, indicating a strong bullish momentum.
- Williams %R: The Williams %R has been hovering in the oversold territory, signaling a potential reversal to the upside.
Volatility Indicators:
- Bollinger Bands: The Bollinger Bands have been narrowing, indicating decreasing volatility and a potential upcoming price breakout.
- Bollinger %B: The %B indicator has been fluctuating around the middle range, suggesting a period of consolidation.
Volume Indicators:
- On-Balance Volume (OBV): The OBV has been relatively stable over the past 5 days, indicating consistent buying pressure.
- Chaikin Money Flow (CMF): The CMF has been positive, reflecting a healthy inflow of money into the stock.
Key Observations and Opinions:
- Trend: The trend indicators suggest a strong bullish sentiment in the stock, supported by the moving averages and MACD analysis.
- Momentum: The momentum indicators indicate a robust bullish momentum, with RSI and Stochastic Oscillator in the overbought zone.
- Volatility: The narrowing Bollinger Bands and stable %B suggest a period of consolidation before a potential breakout.
- Volume: The volume indicators show consistent buying pressure and positive money flow into the stock.
Conclusion:
Based on the analysis of the technical indicators, the stock of PRFD is strongly bullish in the short term. The trend, momentum, and volume indicators all point towards further upside potential. However, the narrowing Bollinger Bands suggest a period of consolidation before a potential breakout. Traders and investors can consider buying opportunities on dips or during consolidation phases to capitalize on the expected upward movement in the stock price.