Technical Analysis of PRFZ 2024-05-10
Overview:
In analyzing the technical indicators for PRFZ over the last 5 days, we will delve into the trend, momentum, volatility, and volume indicators to provide a comprehensive outlook on the possible stock price movement. By examining these key factors, we aim to offer valuable insights and predictions for the upcoming trading days.
Trend Indicators:
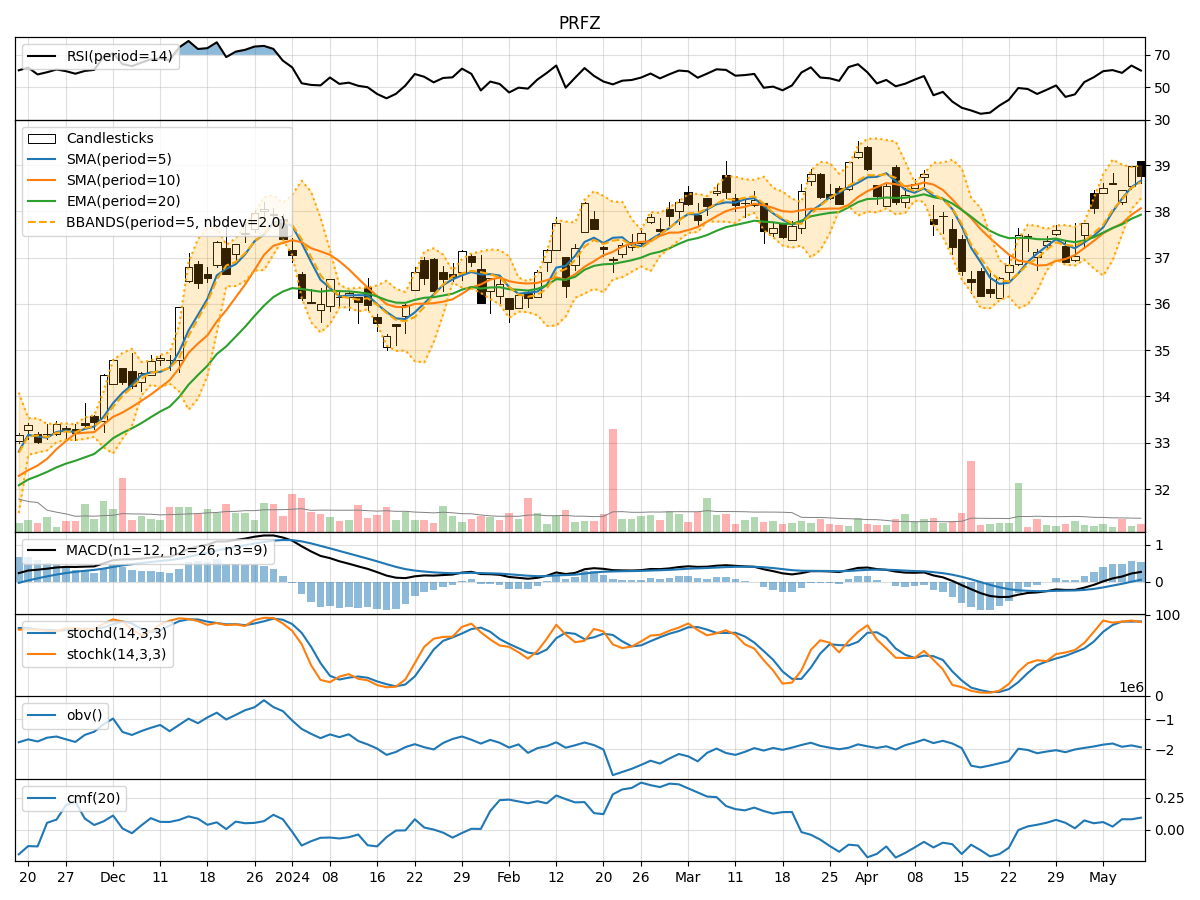
- Moving Averages (MA): The 5-day moving average has been consistently above the simple moving average (SMA) and exponential moving average (EMA), indicating a bullish trend.
- MACD: The MACD line has been consistently above the signal line, with the MACD histogram showing positive values, suggesting bullish momentum.
Momentum Indicators:
- RSI: The Relative Strength Index (RSI) has been fluctuating around the 60 level, indicating a neutral momentum.
- Stochastic Oscillator: Both %K and %D have been hovering in the overbought territory, suggesting a potential reversal or consolidation.
Volatility Indicators:
- Bollinger Bands: The stock price has mostly remained within the Bollinger Bands, with the bands narrowing, indicating decreasing volatility.
Volume Indicators:
- On-Balance Volume (OBV): The OBV has shown mixed movements, reflecting indecision among market participants.
- Chaikin Money Flow (CMF): The CMF has been positive, indicating buying pressure in the market.
Key Observations:
- The trend indicators suggest a bullish sentiment in the short term.
- Momentum indicators show a neutral stance with a potential for a reversal.
- Volatility has been decreasing, indicating a possible period of consolidation.
- Volume indicators reflect mixed signals with slight buying pressure.
Conclusion:
Based on the analysis of the technical indicators, the next few days for PRFZ could see sideways movement with a slight bullish bias. Traders should watch for potential reversals indicated by the stochastic oscillator and monitor the RSI for any shifts in momentum. The decreasing volatility suggests a period of consolidation, while the positive OBV and CMF signal some buying interest. Overall, a cautious approach with a focus on key support and resistance levels is recommended in the upcoming trading sessions.