Technical Analysis of PRNT 2024-05-10
Overview:
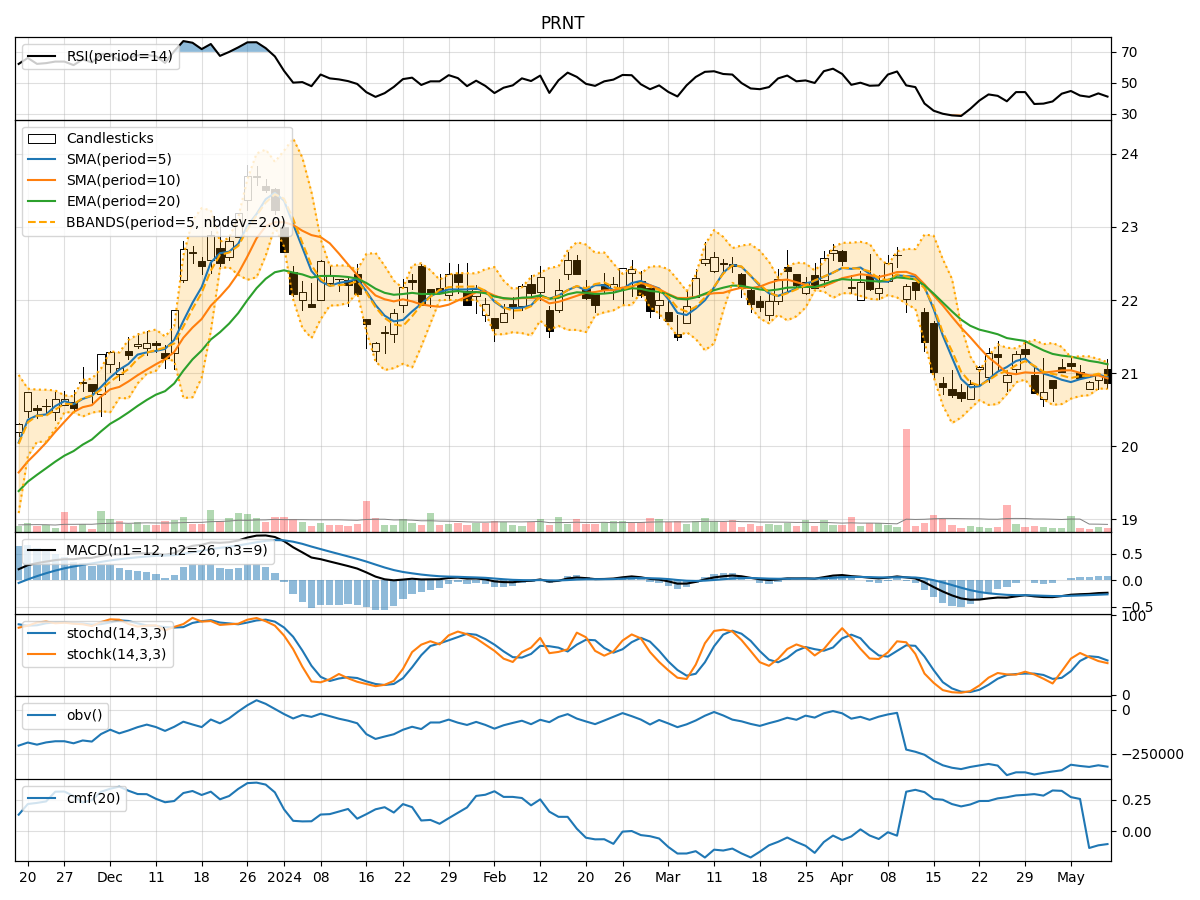
In analyzing the technical indicators for PRNT over the last 5 days, we will delve into the trend, momentum, volatility, and volume indicators to provide a comprehensive outlook on the possible stock price movement in the coming days.
Trend Analysis:
- Moving Averages (MA): The 5-day Moving Average (MA) has been fluctuating around the 20.9 level, indicating a relatively stable trend in the short term.
- MACD: The Moving Average Convergence Divergence (MACD) has been consistently negative, suggesting a bearish momentum in the stock.
- EMA: The Exponential Moving Average (EMA) has been gradually declining, further supporting the bearish sentiment in the short to medium term.
Momentum Analysis:
- RSI: The Relative Strength Index (RSI) has been hovering around the mid-40s, indicating a neutral momentum with no clear overbought or oversold conditions.
- Stochastic Oscillator: Both %K and %D of the Stochastic Oscillator have been trending downwards, signaling a weakening momentum in the stock.
- Williams %R: The Williams %R is in the oversold territory, suggesting a potential reversal or bounce in the stock price.
Volatility Analysis:
- Bollinger Bands (BB): The Bollinger Bands have been narrowing, indicating decreasing volatility in the stock.
- Bollinger %B: The %B indicator is relatively low, suggesting that the stock price is closer to the lower band, potentially indicating an oversold condition.
Volume Analysis:
- On-Balance Volume (OBV): The OBV has been fluctuating with no clear trend, indicating mixed buying and selling pressure in the stock.
- Chaikin Money Flow (CMF): The CMF has been negative, reflecting a bearish money flow in the stock over the past 20 days.
Key Observations:
- The stock is currently in a bearish trend based on the MACD and EMA indicators.
- Momentum is weakening as seen in the declining Stochastic Oscillator and oversold Williams %R.
- Volatility is decreasing, suggesting a potential period of consolidation or a reversal in the stock price.
- Volume indicators show mixed signals with no clear direction in buying or selling pressure.
Conclusion:
Based on the analysis of the technical indicators, the stock is likely to continue its downward trend in the short term. The bearish momentum, coupled with decreasing volatility and mixed volume signals, indicates a potential further decline in the stock price. Traders and investors should exercise caution and consider waiting for more definitive signals before making any buying decisions.