Technical Analysis of PSC 2024-05-10
Overview:
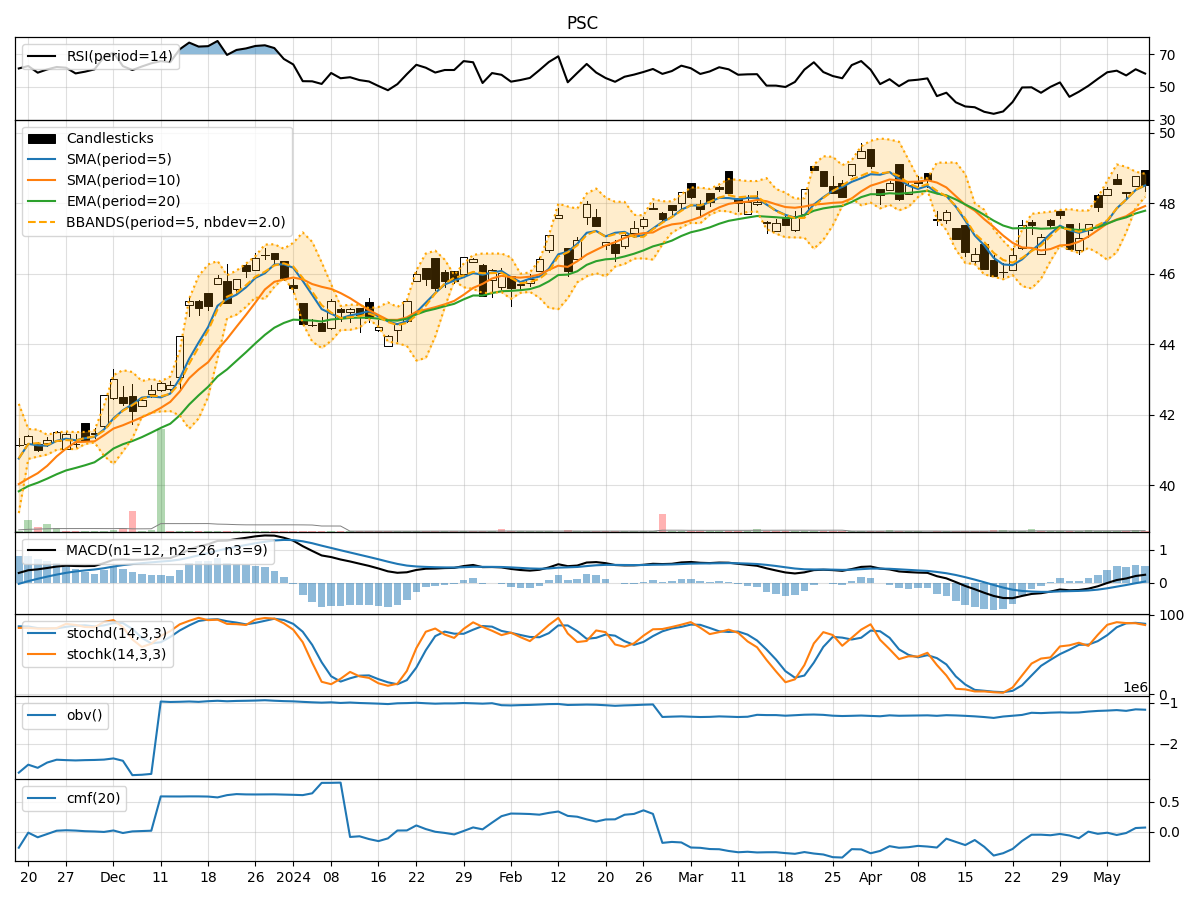
In the last 5 trading days, the stock price of PSC has shown a slight upward trend with fluctuations in volume. The trend indicators suggest a positive momentum, supported by increasing moving averages and MACD values. Momentum indicators indicate a slightly overbought condition, while volatility indicators show narrowing Bollinger Bands. Volume indicators reflect mixed signals with a slightly positive CMF.
Trend Indicators:
- Moving Averages (MA): The 5-day MA has been consistently above the 10-day SMA, indicating a short-term bullish trend.
- MACD: The MACD line has been above the signal line, suggesting a positive momentum in the stock price.
Momentum Indicators:
- RSI: The RSI is in the neutral zone, indicating neither overbought nor oversold conditions.
- Stochastic Oscillator: Both %K and %D are in the overbought region, suggesting a potential reversal or consolidation.
Volatility Indicators:
- Bollinger Bands (BB): The narrowing of the Bollinger Bands indicates decreasing volatility and a potential upcoming breakout.
Volume Indicators:
- On-Balance Volume (OBV): The OBV has shown mixed signals, indicating uncertainty in the buying and selling pressure.
- Chaikin Money Flow (CMF): The CMF is slightly positive, suggesting some accumulation in the stock.
Key Observations:
- The stock price has been on an upward trend, supported by positive MACD values and moving averages.
- Momentum indicators show a slightly overbought condition, which might lead to a short-term correction.
- Volatility is decreasing, indicating a potential period of consolidation before a breakout.
- Volume indicators reflect mixed signals, with a slight positive bias in the CMF.
Conclusion:
Based on the analysis of technical indicators, the next few days' possible stock price movement for PSC is likely to experience a short-term correction or consolidation. The stock may trade within a narrow range before potentially breaking out in the upward direction. Traders should watch for signals of a reversal in the overbought momentum indicators and monitor the Bollinger Bands for a potential breakout. Overall, the outlook for PSC remains neutral to slightly bullish in the short term.