Technical Analysis of PSCC 2024-05-10
Overview:
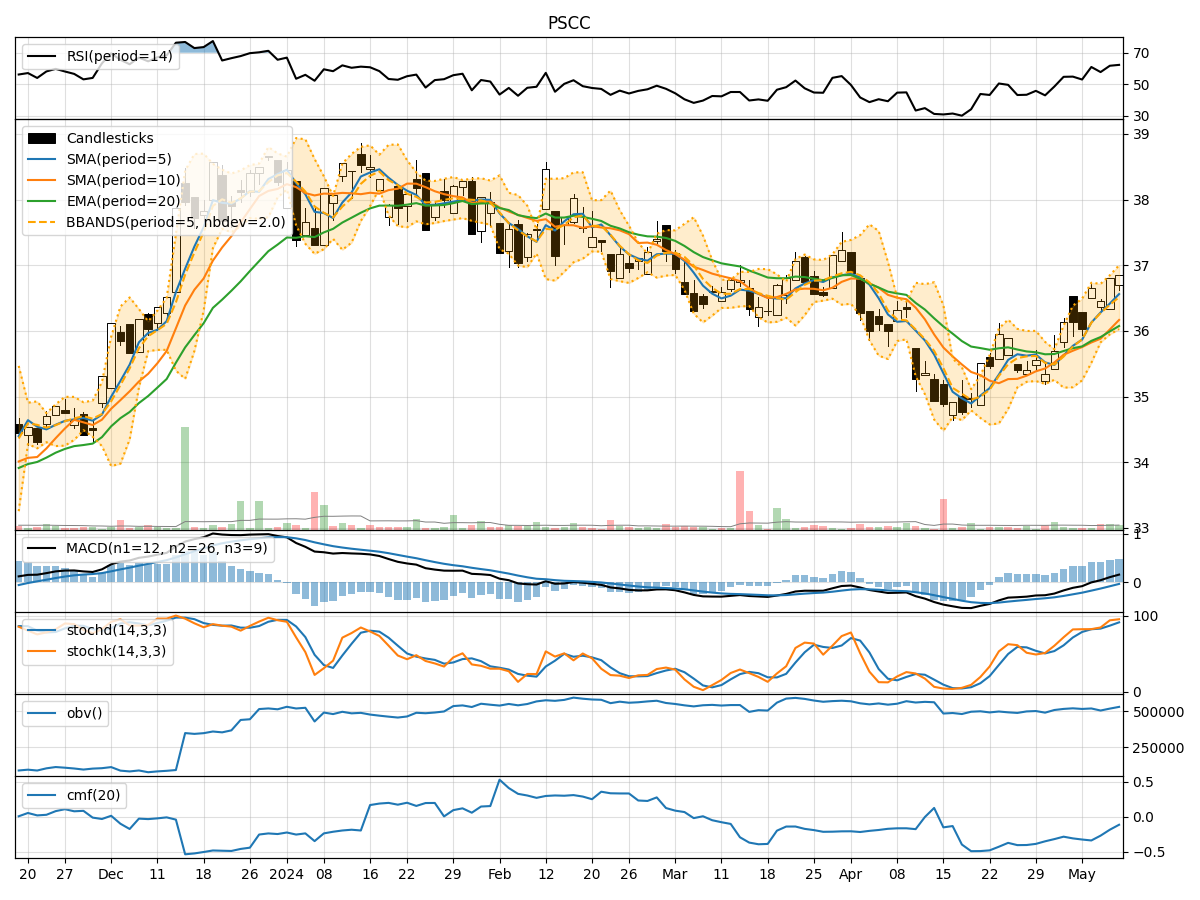
In analyzing the technical indicators for PSCC stock over the last 5 days, we will delve into the trend, momentum, volatility, and volume indicators to provide a comprehensive outlook on the possible stock price movement in the coming days. By examining these key indicators, we aim to offer valuable insights and predictions for potential investors.
Trend Indicators:
- Moving Averages (MA): The 5-day moving average has been consistently above the simple moving average (SMA) and exponential moving average (EMA), indicating a bullish trend.
- MACD: The MACD line has been consistently above the signal line, with both lines showing an upward trend, suggesting bullish momentum.
- MACD Histogram: The histogram has been increasing over the past 5 days, indicating strengthening bullish momentum.
Momentum Indicators:
- RSI: The Relative Strength Index (RSI) has been in the neutral zone around 50-60, suggesting neither overbought nor oversold conditions.
- Stochastic Oscillator: Both %K and %D lines have been in the overbought territory, indicating strong bullish momentum.
- Williams %R: The Williams %R has been hovering around the oversold region, potentially signaling a reversal.
Volatility Indicators:
- Bollinger Bands: The stock price has been trading within the Bollinger Bands, with no significant breaches, indicating stable price volatility.
- Bollinger %B: The %B indicator has been fluctuating around the midline, suggesting a lack of extreme price movements.
Volume Indicators:
- On-Balance Volume (OBV): The OBV has shown a slight decline over the past 5 days, indicating some selling pressure.
- Chaikin Money Flow (CMF): The CMF has been negative, reflecting a lack of buying pressure in the stock.
Key Observations and Opinions:
- Trend: The trend indicators suggest a strong bullish sentiment in the stock, supported by the moving averages and MACD analysis.
- Momentum: The momentum indicators indicate a mix of bullish and bearish signals, with the RSI in a neutral zone and stochastic oscillator showing overbought conditions.
- Volatility: The volatility indicators point towards a stable price movement within the Bollinger Bands, indicating a lack of significant price fluctuations.
- Volume: The volume indicators reflect a slight decrease in buying pressure, as seen in the OBV and CMF readings.
Conclusion:
Based on the analysis of the technical indicators, the stock of PSCC is likely to experience further upward movement in the coming days. The strong bullish trend indicated by the moving averages and MACD, coupled with stable volatility and mixed momentum signals, suggests a potential continuation of the current uptrend. However, investors should closely monitor the overbought conditions highlighted by the stochastic oscillator and be cautious of a possible reversal indicated by the Williams %R. Overall, the outlook for PSCC stock remains bullish in the short term.