Technical Analysis of PSCD 2024-05-10
Overview:
In analyzing the technical indicators for PSCD over the last 5 days, we will delve into the trend, momentum, volatility, and volume indicators to provide a comprehensive outlook on the possible stock price movement in the coming days. By examining these key indicators, we aim to offer valuable insights and predictions for informed decision-making.
Trend Analysis:
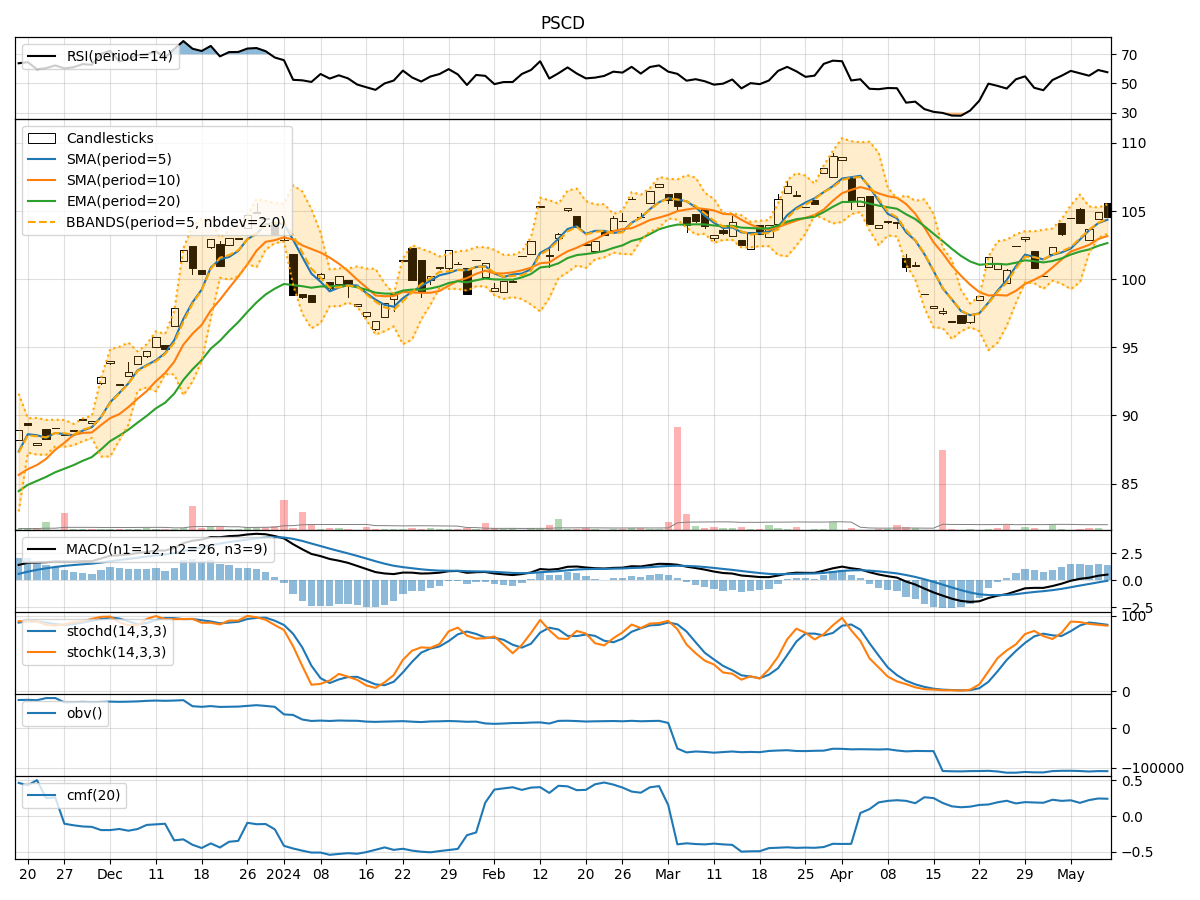
- Moving Averages (MA): The 5-day MA has been consistently above the 10-day SMA, indicating a short-term bullish trend. The EMA(20) has shown a gradual uptrend, suggesting positive momentum in the stock price.
- MACD: The MACD line has been above the signal line for the past 5 days, indicating a bullish trend. The MACD histogram has been mostly positive, further supporting the bullish sentiment.
Momentum Analysis:
- RSI: The RSI(14) has been fluctuating around the 50 level, indicating a neutral momentum in the stock. There is no extreme overbought or oversold conditions.
- Stochastic Oscillator: Both %K and %D lines of the Stochastic Oscillator have been trending downwards, suggesting a potential weakening of momentum.
- Williams %R: The Williams %R is hovering around the oversold territory, indicating a possible reversal in the short term.
Volatility Analysis:
- Bollinger Bands: The stock price has mostly stayed within the Bollinger Bands over the last 5 days, indicating a period of consolidation. The bands have not shown significant expansion or contraction.
- Bollinger %B: The %B indicator has been fluctuating around the midline, suggesting a lack of strong trend direction.
Volume Analysis:
- On-Balance Volume (OBV): The OBV has shown a slight decline over the last 5 days, indicating some distribution happening in the stock.
- Chaikin Money Flow (CMF): The CMF(20) has been positive, indicating buying pressure in the stock over the past 20 days.
Conclusion:
Based on the analysis of the technical indicators, the stock of PSCD is currently in a consolidation phase with neutral momentum. The trend indicators suggest a short-term bullish bias, supported by the moving averages and MACD. However, the momentum indicators like Stochastic Oscillator and Williams %R signal a potential weakening of momentum in the near term.
Considering the volatility and volume indicators, there is a lack of significant movements or strong trends, indicating a period of consolidation and indecision in the market. Therefore, the next few days are likely to see the stock price of PSCD trading sideways with a slight upward bias.
Investors should closely monitor key support and resistance levels, as a breakout in either direction could signal a new trend. It is advisable to wait for more clarity in the market dynamics before making significant trading decisions.