Technical Analysis of PSCH 2024-05-10
Overview:
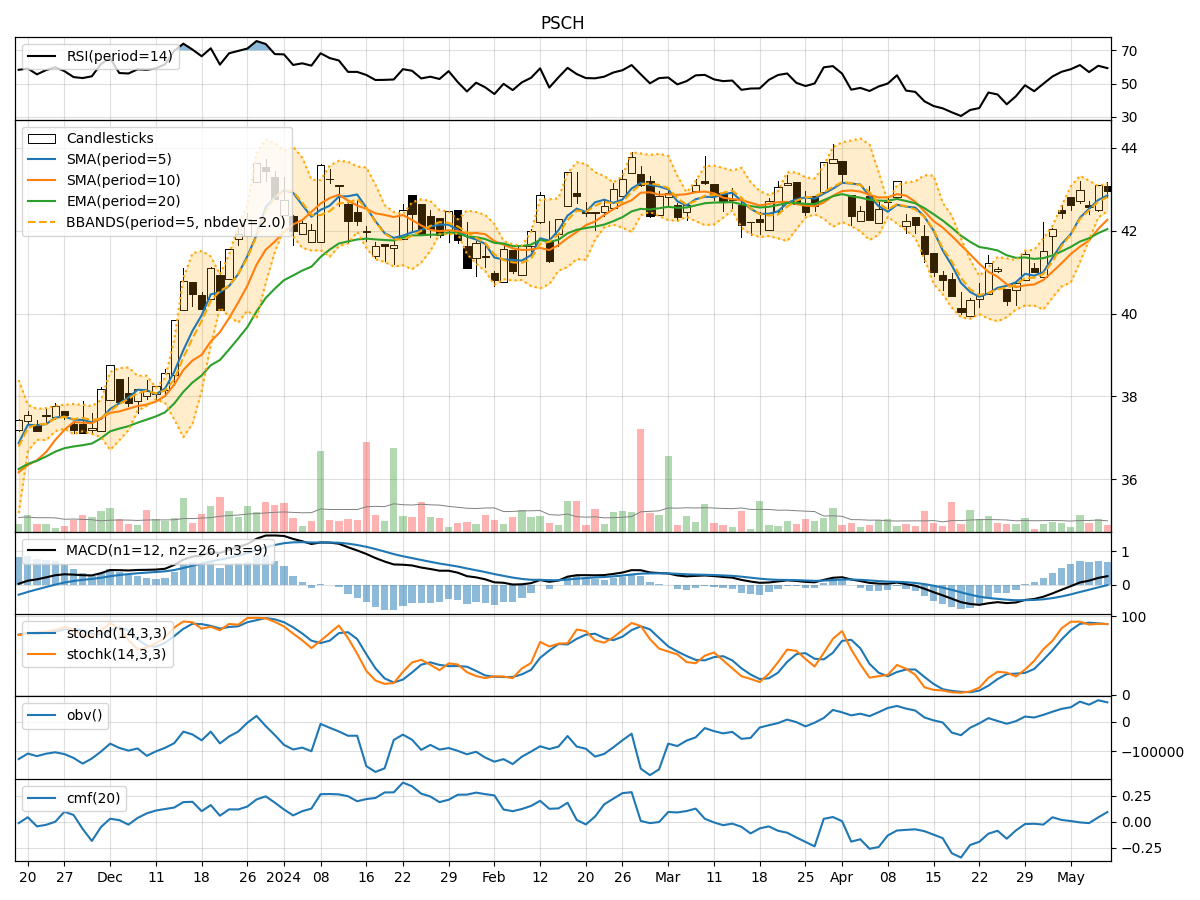
In the last 5 trading days, PSCH stock has shown mixed signals across various technical indicators. The trend indicators suggest a slightly bullish sentiment, with the moving averages trending upwards. Momentum indicators indicate a neutral to slightly bullish momentum, while volatility indicators show a decreasing trend in volatility. Volume indicators also suggest a slightly positive sentiment with increasing On-Balance Volume (OBV) and Chaikin Money Flow (CMF) values.
Trend Indicators:
- Moving averages (MA) are trending upwards, indicating a bullish sentiment in the short term.
- Exponential Moving Average (EMA) is also showing an upward trend, supporting the bullish outlook.
- Moving Average Convergence Divergence (MACD) is positive, with the MACD line above the signal line, indicating a bullish trend.
Momentum Indicators:
- Relative Strength Index (RSI) is in the neutral zone, suggesting a balanced momentum.
- Stochastic Oscillator (StochK and StochD) are in the overbought region, indicating a potential reversal or consolidation.
- Williams %R (WillR) is also in the oversold region, signaling a possible reversal.
Volatility Indicators:
- Bollinger Bands (BB) are narrowing, indicating decreasing volatility and a potential breakout or breakdown.
- Bollinger Band Percentage (BBP) is decreasing, suggesting a consolidation phase.
Volume Indicators:
- On-Balance Volume (OBV) is increasing, indicating accumulation by investors.
- Chaikin Money Flow (CMF) is positive, suggesting buying pressure in the stock.
Key Observations:
- Trend: The trend indicators show a bullish bias in the short term.
- Momentum: Momentum indicators are mixed, with a neutral to slightly bullish outlook.
- Volatility: Volatility is decreasing, indicating a potential consolidation phase.
- Volume: Volume indicators suggest a positive sentiment with increasing OBV and CMF values.
Conclusion:
Based on the analysis of technical indicators, the next few days' possible stock price movement for PSCH is likely to be sideways or consolidating with a slightly bullish bias. Traders should watch for a potential breakout or breakdown from the narrowing Bollinger Bands and monitor the Stochastic Oscillator for any reversal signals. Overall, the stock is expected to trade within a range with a tendency towards a bullish bias in the short term.