Technical Analysis of PSCJ 2024-05-10
Overview:
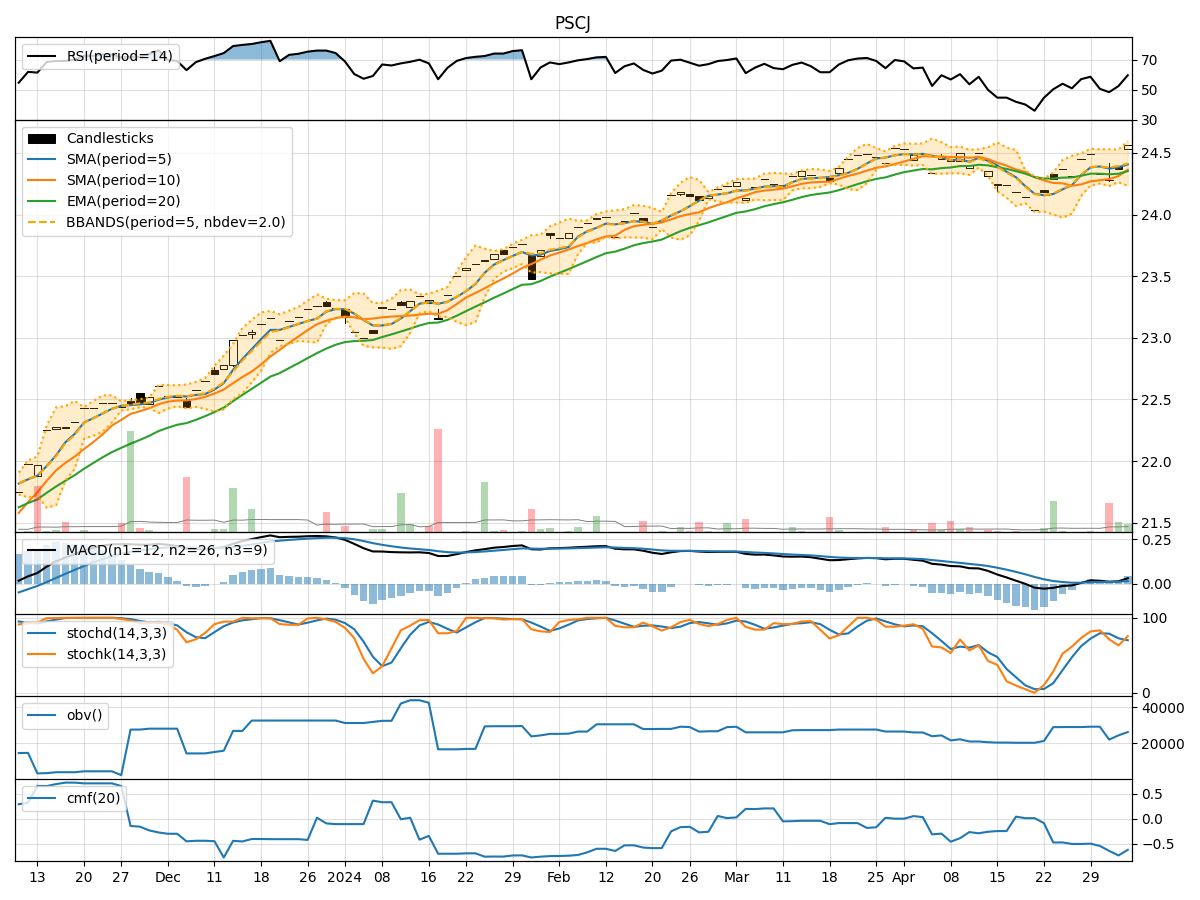
In the last 5 trading days, PSCJ stock has shown a consistent uptrend in its price movement. The moving averages (MA) have been trending upwards, with the 5-day MA consistently above the 10-day simple moving average (SMA) and the 20-day exponential moving average (EMA). The MACD indicator has been positive, indicating bullish momentum. The Relative Strength Index (RSI) has been in the overbought territory, suggesting a strong buying pressure. The Bollinger Bands have been expanding, indicating increased volatility. However, the On-Balance Volume (OBV) and Chaikin Money Flow (CMF) have been negative, suggesting some distribution of shares.
Trend Indicators:
- Moving Averages: The 5-day MA has been consistently above the 10-day SMA and 20-day EMA, indicating a strong uptrend.
- MACD: The MACD line has been above the signal line, showing bullish momentum.
Momentum Indicators:
- RSI: The RSI has been in the overbought zone, suggesting a strong buying pressure.
- Stochastic Oscillator: The Stochastic indicators have been in the overbought zone, indicating a potential reversal.
Volatility Indicators:
- Bollinger Bands: The Bollinger Bands have been expanding, indicating increased volatility in the stock price.
Volume Indicators:
- OBV and CMF: Both OBV and CMF have been negative, suggesting some distribution of shares despite the price uptrend.
Key Observations:
- The stock has been in a strong uptrend based on moving averages and MACD.
- Momentum indicators like RSI and Stochastic suggest overbought conditions, which could lead to a potential pullback.
- Volatility has been increasing, which could lead to larger price swings.
- The negative OBV and CMF indicate some selling pressure despite the price increase.
Conclusion:
Based on the technical indicators and analysis: - The stock is likely to experience a short-term pullback or consolidation due to overbought conditions indicated by RSI and Stochastic. - Volatility is expected to remain high, leading to potential price swings in the coming days. - The overall trend remains bullish, but caution is advised for short-term traders due to the possibility of a correction.
Recommendation:
- Consider taking profits if you are a short-term trader and wait for a better entry point.
- Long-term investors can hold their positions but monitor the indicators closely for any signs of a trend reversal.
- It is advisable to set stop-loss levels to protect profits in case of a sudden downturn.
Disclaimer:
The analysis provided is based on historical data and technical indicators, and market conditions can change rapidly. It is essential to conduct thorough research and consider other factors before making any investment decisions. Consulting with a financial advisor is recommended for personalized guidance tailored to your specific investment goals and risk tolerance level.