Technical Analysis of PSCM 2024-05-10
Overview:
In analyzing the provided Technical Analysis (TA) data for the last 5 days of PSCM stock, we will delve into various technical indicators across trend, momentum, volatility, and volume categories to derive insights into the possible future stock price movement. By examining these indicators comprehensively, we aim to provide a well-informed prediction backed by data-driven analysis and expert interpretation.
Trend Analysis:
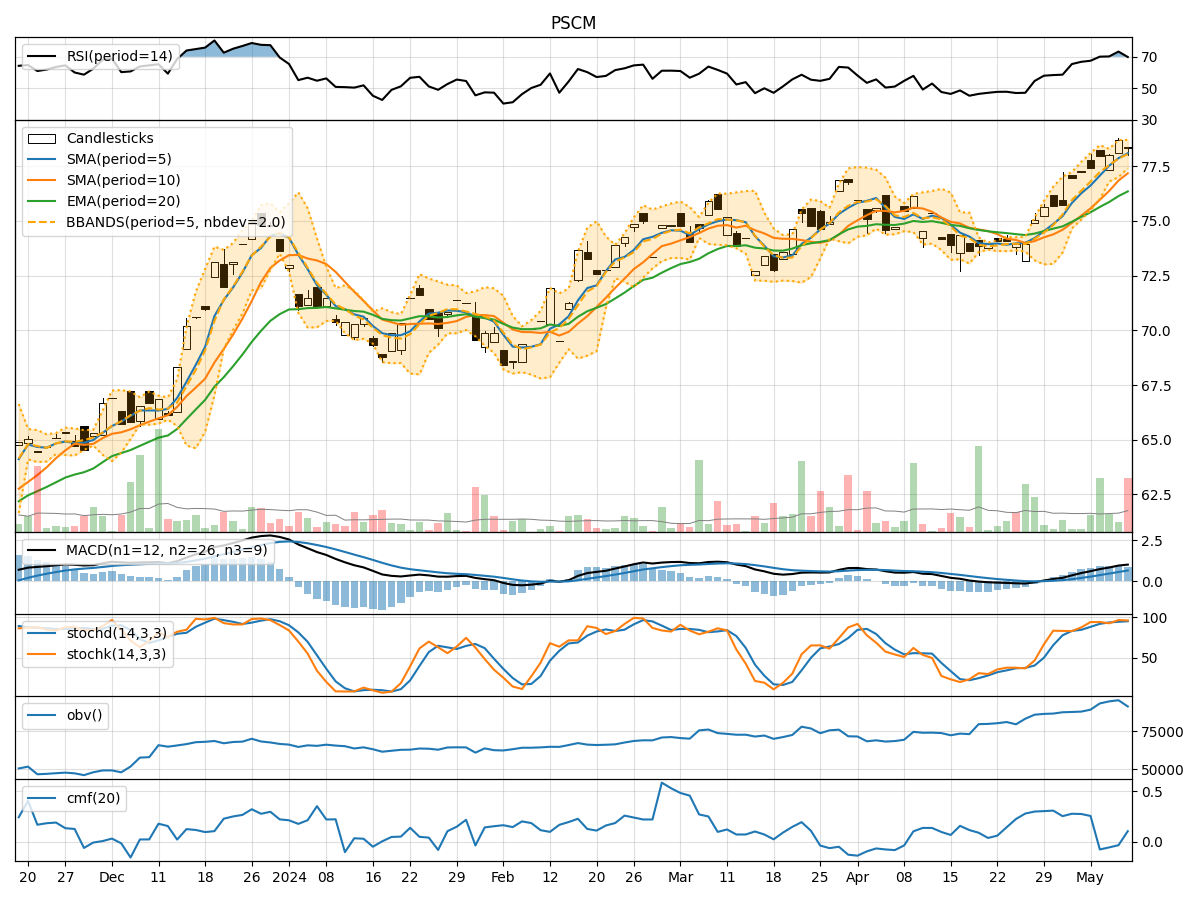
- Moving Averages (MA): The 5-day Moving Average (MA) has been consistently trending upwards, indicating a positive momentum in the stock price.
- MACD: The Moving Average Convergence Divergence (MACD) has shown an increasing trend, with the MACD line consistently above the signal line, suggesting a bullish momentum.
- RSI: The Relative Strength Index (RSI) has been in the overbought territory, indicating a strong bullish sentiment in the market.
Momentum Analysis:
- Stochastic Oscillator: Both %K and %D lines of the Stochastic Oscillator have been in the overbought zone, signaling a potential reversal or consolidation in the stock price.
- Williams %R: The Williams %R indicator has been consistently in the oversold region, suggesting a possible reversal in the near future.
Volatility Analysis:
- Bollinger Bands: The Bollinger Bands have shown a narrowing of the bands, indicating decreasing volatility and a potential period of consolidation.
- Average True Range (ATR): The ATR value has been relatively stable, suggesting a lack of significant price fluctuations.
Volume Analysis:
- On-Balance Volume (OBV): The OBV indicator has shown a mixed trend, indicating indecision among market participants regarding the stock.
- Chaikin Money Flow (CMF): The CMF has been negative, suggesting a net outflow of money from the stock.
Conclusion:
Based on the analysis of the technical indicators, the stock price of PSCM is likely to experience a period of consolidation in the upcoming days. The bullish momentum indicated by moving averages and MACD may face resistance due to overbought conditions in the Stochastic Oscillator and RSI. The narrowing Bollinger Bands and stable ATR point towards a potential sideways movement. The mixed signals from OBV and negative CMF further support the view of a consolidation phase.
Recommendation:
- Short-term Traders: Consider taking profits or reducing positions as the stock enters a consolidation phase.
- Long-term Investors: Monitor the price action closely for a potential entry point during the consolidation period.
- Risk Management: Implement stop-loss orders to protect gains and manage downside risk in case of a sudden price reversal.
Key Takeaway:
The technical analysis suggests a sideways movement in the stock price of PSCM in the near term, with a potential for a breakout in either direction post-consolidation. It is essential for investors to stay vigilant and adapt their strategies based on evolving market dynamics and price action.