Technical Analysis of PSCQ 2024-05-10
Overview:
In analyzing the provided Technical Analysis (TA) data for the last 5 days of PSCQ stock, we will delve into the trend, momentum, volatility, and volume indicators to forecast the possible stock price movement in the upcoming days. By examining these key indicators, we aim to provide a comprehensive and insightful prediction for the future direction of PSCQ stock.
Trend Indicators:
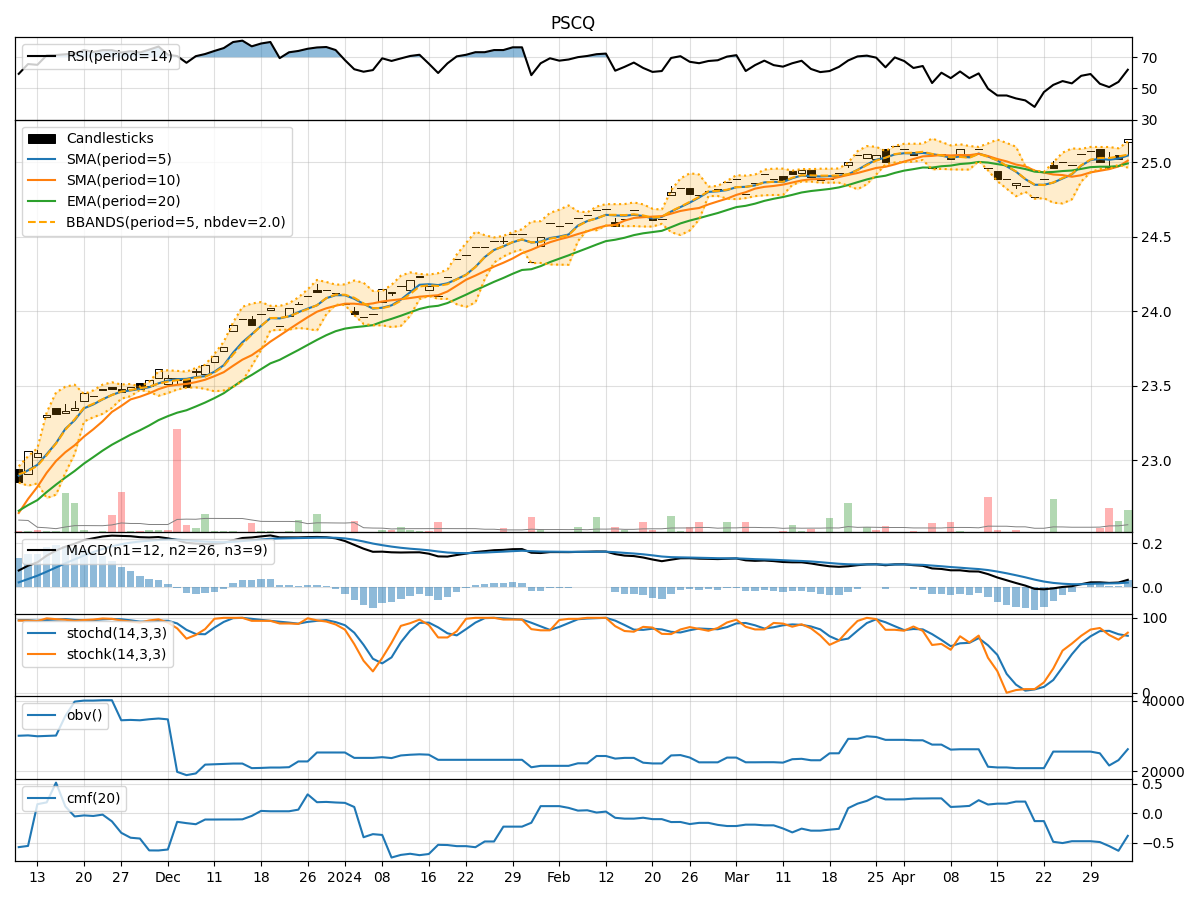
- Moving Averages (MA): The 5-day Moving Average (MA) has been consistently above the Simple Moving Average (SMA) and Exponential Moving Average (EMA) over the past 5 days, indicating a bullish trend.
- MACD: The Moving Average Convergence Divergence (MACD) and its signal line have been steadily increasing, with the MACD line consistently above the signal line, suggesting bullish momentum in the stock price.
Momentum Indicators:
- RSI: The Relative Strength Index (RSI) has been hovering in the range of 60-70, indicating neutral momentum in the stock.
- Stochastic Oscillator: Both %K and %D lines of the Stochastic Oscillator have been fluctuating around the overbought territory, suggesting a potential reversal in the stock price.
Volatility Indicators:
- Bollinger Bands (BB): The Bollinger Bands have shown a slight expansion, indicating increased volatility in the stock price.
Volume Indicators:
- On-Balance Volume (OBV): The OBV has been relatively stable over the past 5 days, suggesting neutral volume flow in the stock.
- Chaikin Money Flow (CMF): The CMF has been consistently negative, indicating selling pressure in the stock.
Key Observations and Opinions:
- The trend indicators suggest a bullish bias in the stock price, supported by the MACD and moving averages.
- Momentum indicators show a neutral to slightly bearish sentiment, with the RSI indicating a lack of strong momentum.
- Volatility indicators point towards increased volatility, which could lead to larger price swings in the near future.
- Volume indicators reflect neutral volume flow with a slight selling pressure, as indicated by the CMF.
Conclusion:
Based on the analysis of the technical indicators, the next few days' possible stock price movement for PSCQ is likely to experience increased volatility with a bullish bias in the trend. However, the neutral momentum and selling pressure indicated by the momentum and volume indicators suggest a potential for consolidation or sideways movement in the short term. Traders and investors should closely monitor key support and resistance levels to gauge the stock's future direction.
Recommendation:
Considering the mixed signals from the technical indicators, it is advisable to exercise caution and wait for further confirmation before making significant trading decisions. Keep a close eye on key levels and monitor any developments in market sentiment that could influence the stock price movement.