Technical Analysis of PSCT 2024-05-10
Overview:
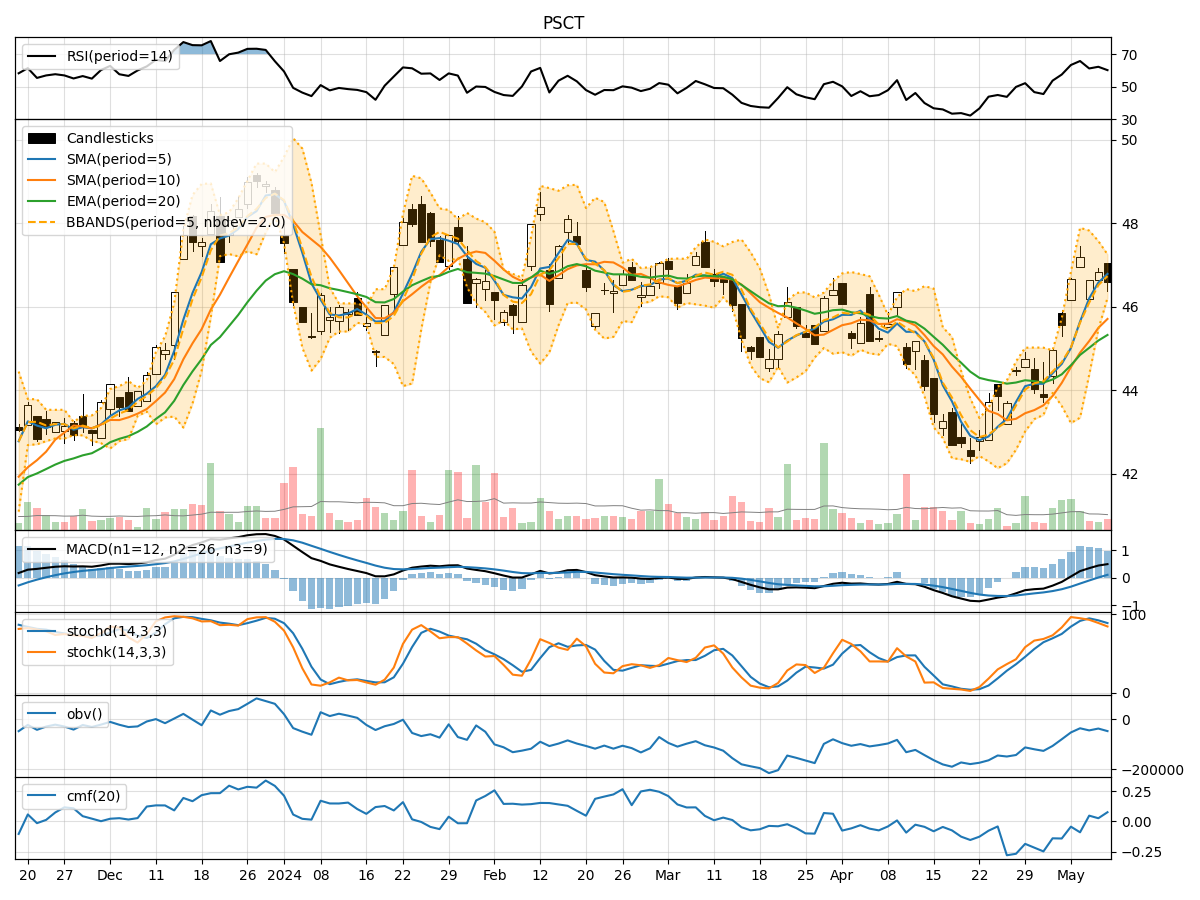
In analyzing the technical indicators for PSCT over the last 5 days, we will delve into the trend, momentum, volatility, and volume indicators to provide a comprehensive outlook on the possible stock price movement in the coming days.
Trend Indicators:
- Moving Averages (MA): The 5-day MA has been consistently above the 10-day SMA, indicating a short-term bullish trend.
- Exponential Moving Average (EMA): The EMA has been steadily increasing, reflecting positive price momentum.
- Moving Average Convergence Divergence (MACD): The MACD line has been above the signal line, suggesting bullish momentum.
- MACD Histogram: The histogram has been showing an uptrend, indicating strengthening bullish momentum.
Momentum Indicators:
- Relative Strength Index (RSI): RSI has been in the overbought territory, signaling a strong bullish momentum.
- Stochastic Oscillator: Both %K and %D have been declining but remain in the overbought zone, indicating a potential reversal.
- Williams %R (WillR): WillR has been in the oversold region, suggesting a possible bullish reversal.
Volatility Indicators:
- Bollinger Bands (BB): The stock price has been trading within the bands, indicating a period of consolidation.
- Bollinger Band Width (BBW): The BBW has been narrowing, suggesting decreasing volatility.
- Bollinger Band %B (BBP): BBP has been fluctuating around the midline, indicating a lack of clear trend direction.
Volume Indicators:
- On-Balance Volume (OBV): OBV has shown mixed signals, reflecting indecision among market participants.
- Chaikin Money Flow (CMF): CMF has been fluctuating around the zero line, indicating a balance between buying and selling pressure.
Key Observations:
- The trend indicators suggest a bullish bias in the short term.
- Momentum indicators indicate a potential reversal in the overbought conditions.
- Volatility indicators point towards a period of consolidation and decreasing volatility.
- Volume indicators show mixed signals with no clear direction.
Conclusion:
Based on the analysis of the technical indicators, the stock price of PSCT is likely to experience sideways movement in the coming days. The bullish trend may lose momentum, leading to a period of consolidation. Traders should exercise caution and wait for clearer signals before making significant trading decisions.