Technical Analysis of PSCX 2024-05-10
Overview:
In analyzing the technical indicators for PSCX over the last 5 days, we will delve into the trend, momentum, volatility, and volume indicators to provide a comprehensive outlook on the possible stock price movement in the coming days. By examining these key aspects, we aim to offer valuable insights and predictions for informed decision-making.
Trend Indicators:
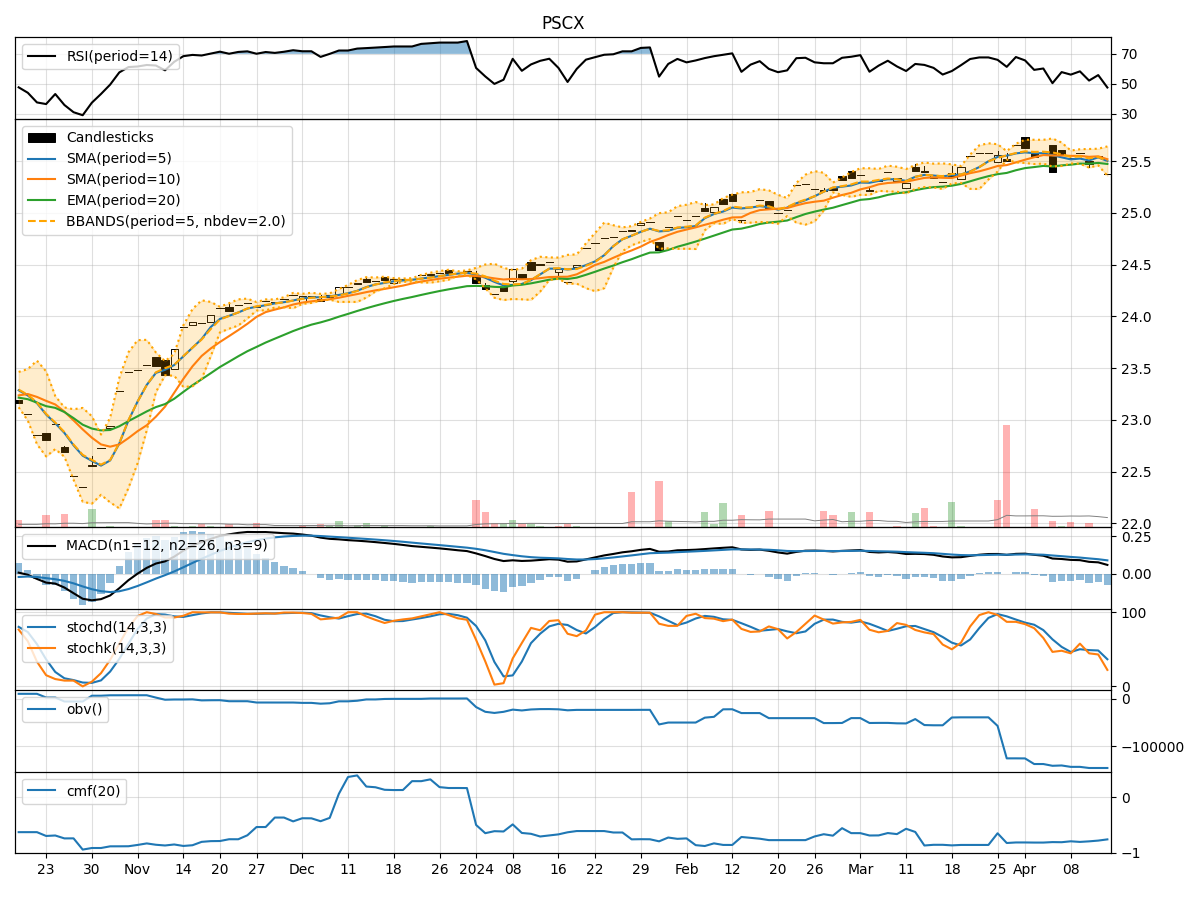
- Moving Averages (MA): The 5-day MA has been consistently above the closing prices, indicating a bullish trend.
- MACD: The MACD line has been consistently above the signal line, suggesting a bullish momentum.
- EMA: The EMA has been trending upwards, supporting the bullish sentiment.
Momentum Indicators:
- RSI: The RSI has been in the neutral zone, indicating neither overbought nor oversold conditions.
- Stochastic Oscillator: Both %K and %D have been relatively high, suggesting bullish momentum.
- Williams %R: The indicator has been hovering around 0, indicating a neutral stance.
Volatility Indicators:
- Bollinger Bands (BB): The stock price has been trading within the bands, showing moderate volatility.
- BB Width: The bands have been relatively narrow, indicating a period of consolidation.
- BB %B: The %B indicator has been around 0.8, signifying an uptrend.
Volume Indicators:
- On-Balance Volume (OBV): The OBV has been slightly negative, indicating some distribution.
- Chaikin Money Flow (CMF): The CMF has been negative, suggesting outflow of money from the stock.
Key Observations:
- The trend indicators point towards a bullish sentiment with moving averages and MACD supporting an upward trajectory.
- Momentum indicators show a neutral to slightly bullish stance, with RSI and Williams %R indicating a balanced market sentiment.
- Volatility indicators suggest a period of consolidation with moderate price fluctuations within the Bollinger Bands.
- Volume indicators reflect a slight distribution of shares with OBV showing a negative trend.
Conclusion:
Based on the analysis of the technical indicators, the stock is likely to continue its upward trend in the next few days. The bullish signals from trend and momentum indicators outweigh the neutral to slightly negative signals from volume and volatility indicators. Therefore, investors can consider buying or holding positions in PSCX for potential gains in the near term.