Technical Analysis of PSET 2024-05-10
Overview:
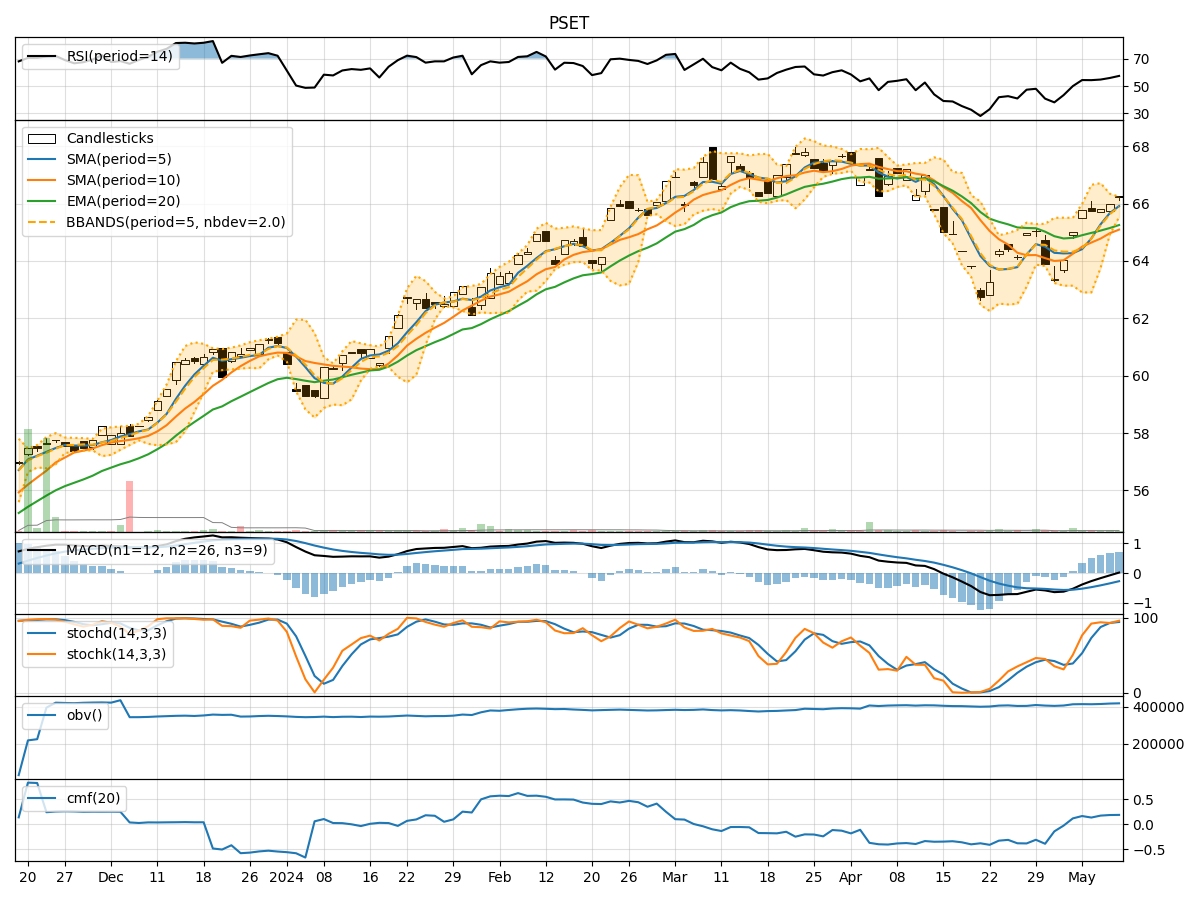
In the last 5 trading days, the stock price has shown a gradual increase, with the closing price rising from 65.76 to 66.23. Various technical indicators have been analyzed to provide insights into the possible future stock price movement. The trend indicators, momentum indicators, volatility indicators, and volume indicators have been considered to make a comprehensive analysis.
Trend Indicators:
- Moving Averages (MA): The moving averages have been on an upward trend, indicating a positive momentum in the stock price.
- MACD (Moving Average Convergence Divergence): The MACD line has been consistently above the signal line, suggesting a bullish trend.
- RSI (Relative Strength Index): The RSI has been increasing, showing strengthening momentum in the stock price.
Momentum Indicators:
- Stochastic Oscillator: Both %K and %D have been in the overbought zone, indicating a potential reversal or consolidation.
- Williams %R: The Williams %R has been hovering near the oversold territory, suggesting a possible reversal in the short term.
Volatility Indicators:
- Bollinger Bands: The stock price has been trading within the upper Bollinger Band, indicating an overbought condition.
- Volatility Bands: The volatility has been decreasing, which could signal a period of consolidation or a potential reversal.
Volume Indicators:
- On-Balance Volume (OBV): The OBV has been increasing, showing accumulation of the stock by investors.
- Chaikin Money Flow (CMF): The CMF has been positive, indicating buying pressure in the stock.
Key Observations and Opinions:
- Trend: The stock is in an upward trend based on moving averages and MACD.
- Momentum: The momentum indicators suggest a potential reversal or consolidation in the short term.
- Volatility: The stock is currently in an overbought condition based on Bollinger Bands.
- Volume: The volume indicators show positive accumulation and buying pressure.
Conclusion:
Based on the analysis of the technical indicators, the stock is likely to experience a short-term consolidation or pullback due to the overbought conditions indicated by the momentum and volatility indicators. However, the overall trend remains bullish supported by the moving averages and MACD. Investors should be cautious of a potential reversal in the short term but maintain a long-term bullish outlook on the stock.