Technical Analysis of PSFF 2024-05-10
Overview:
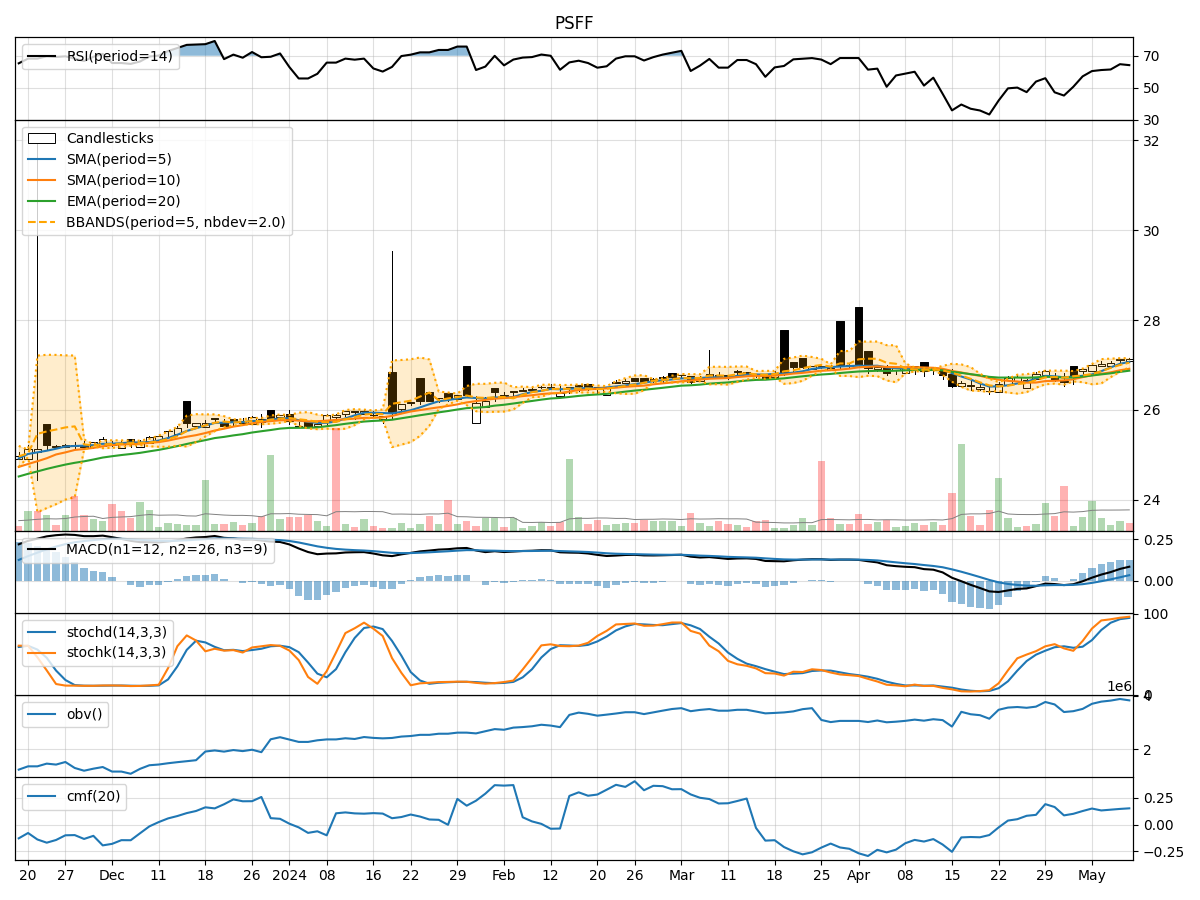
In analyzing the technical indicators for PSFF stock over the last 5 days, we will delve into the trend, momentum, volatility, and volume indicators to provide a comprehensive assessment of the stock's potential price movement. By examining these key indicators, we aim to offer insights into the possible future direction of PSFF stock.
Trend Indicators:
- Moving Averages (MA): The 5-day MA has been consistently above the closing price, indicating a short-term uptrend.
- MACD: The MACD line has been trending upwards, with the MACD histogram showing positive values, suggesting bullish momentum.
- EMA: The EMA has been steadily increasing, reflecting a positive trend in the stock price.
Key Observation: The trend indicators point towards a bullish sentiment in the stock price.
Momentum Indicators:
- RSI: The RSI has been in the range of 60-65, indicating a moderate level of buying pressure.
- Stochastic Oscillator: Both %K and %D have been in the overbought zone, suggesting a potential reversal or consolidation.
- Williams %R: The Williams %R is hovering around -5 to -8, indicating an overbought condition.
Key Observation: Momentum indicators suggest a cautious outlook due to the overbought levels.
Volatility Indicators:
- Bollinger Bands: The stock price has been trading within the upper Bollinger Band, indicating an overbought condition.
- Bollinger %B: The %B indicator has been above 0.5, suggesting an elevated price level relative to the bands.
Key Observation: Volatility indicators signal a potential pullback or consolidation in the stock price.
Volume Indicators:
- On-Balance Volume (OBV): The OBV has shown a slight increase, indicating some accumulation by investors.
- Chaikin Money Flow (CMF): The CMF has been positive, reflecting buying pressure in the stock.
Key Observation: Volume indicators support a moderate bullish bias in the stock.
Conclusion:
Based on the analysis of the technical indicators, the stock is currently exhibiting a bullish trend with positive momentum and volume support. However, the overbought levels in the momentum indicators and the high position relative to the Bollinger Bands suggest a potential correction or consolidation in the near term. Investors should exercise caution and consider profit-taking strategies as the stock may experience a short-term pullback before potentially resuming its upward trajectory.
Overall View: The stock is likely to experience a short-term correction before potentially continuing its bullish trend. Investors should monitor the price action closely and consider adjusting their positions accordingly.