Technical Analysis of PSFM 2024-05-10
Overview:
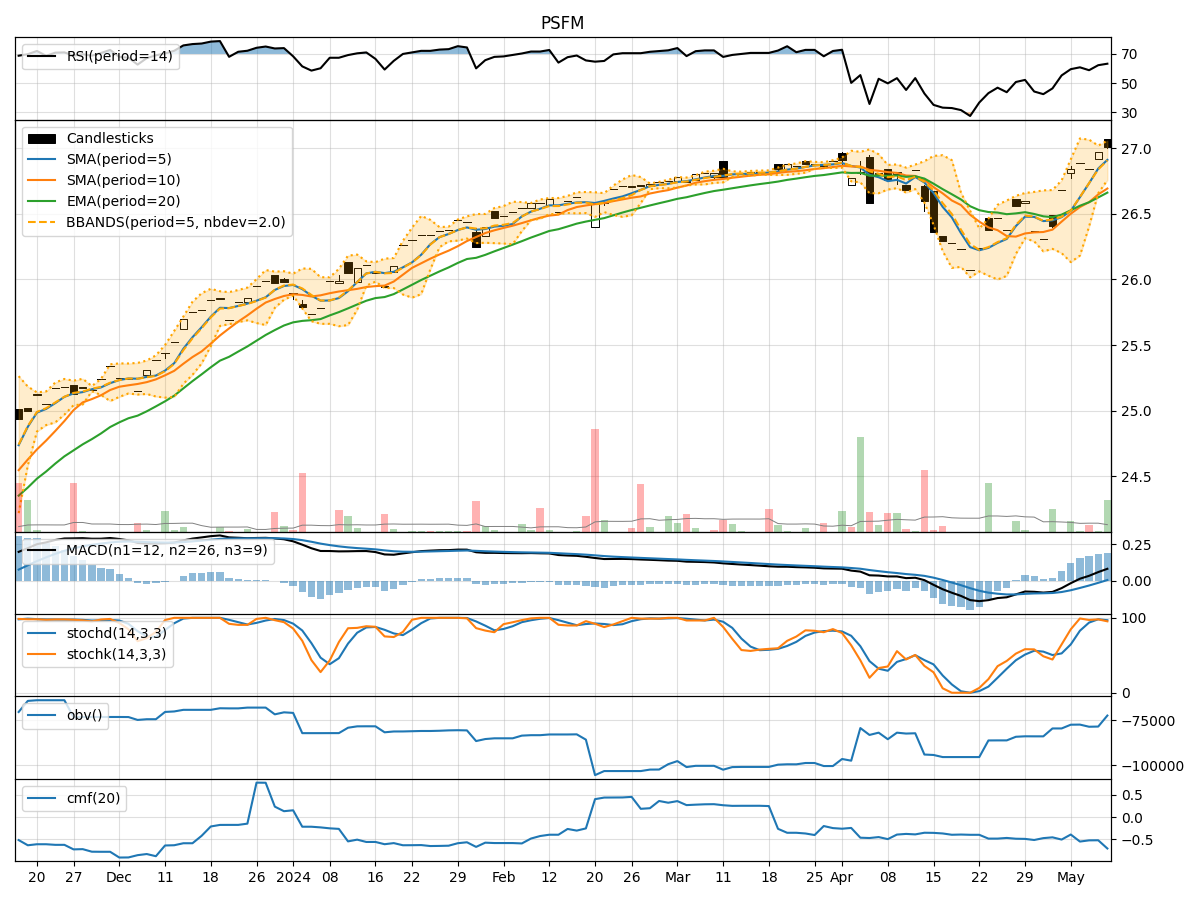
In the last 5 trading days, PSFM stock has shown a consistent uptrend in price, with increasing volumes. The trend indicators suggest a positive momentum, supported by the moving averages and MACD. Momentum indicators like RSI and Stochastic oscillators indicate overbought conditions but still show strength. Volatility indicators show narrowing Bollinger Bands, indicating potential price consolidation. Volume indicators also reflect a mixed sentiment.
Trend Indicators Analysis:
- Moving Averages (MA): The 5-day MA is consistently above the longer-term SMAs, indicating a short-term uptrend.
- MACD: The MACD line is above the signal line, indicating bullish momentum.
- EMA: The EMA is trending upwards, supporting the bullish sentiment.
Momentum Indicators Analysis:
- RSI: The RSI is in the overbought zone but has room for further upside.
- Stochastic Oscillators: Both %K and %D are in the overbought region, suggesting a potential reversal.
- Williams %R (WillR): The Williams %R is also in the overbought territory.
Volatility Indicators Analysis:
- Bollinger Bands (BB): The narrowing of the Bollinger Bands suggests decreasing volatility and a possible period of consolidation.
- BB %B: The %B is above 0.8, indicating a potential overbought condition.
Volume Indicators Analysis:
- On-Balance Volume (OBV): The OBV has been increasing, reflecting accumulation by investors.
- Chaikin Money Flow (CMF): The CMF is negative, indicating selling pressure in the short term.
Key Observations:
- The stock is in a strong uptrend based on trend indicators.
- Momentum indicators suggest overbought conditions but still show strength.
- Volatility indicators point towards a potential period of consolidation.
- Volume indicators reflect mixed sentiment, with OBV showing accumulation but CMF indicating selling pressure.
Conclusion:
Based on the technical analysis of PSFM stock: - Trend: The stock is in a strong uptrend supported by moving averages and MACD. - Momentum: Momentum indicators suggest overbought conditions but with ongoing strength. - Volatility: Volatility indicators point towards a potential period of consolidation. - Volume: Volume indicators reflect mixed sentiment with accumulation and selling pressure.
Overall Assessment:
Considering the uptrend, strong momentum, and potential consolidation indicated by the technical indicators, the next few days may see the stock price continue its upward movement with a possibility of a short-term consolidation phase. Investors should closely monitor the price action for any signs of a reversal in momentum or a breakout from the consolidation pattern.