Technical Analysis of PSFO 2024-05-10
Overview:
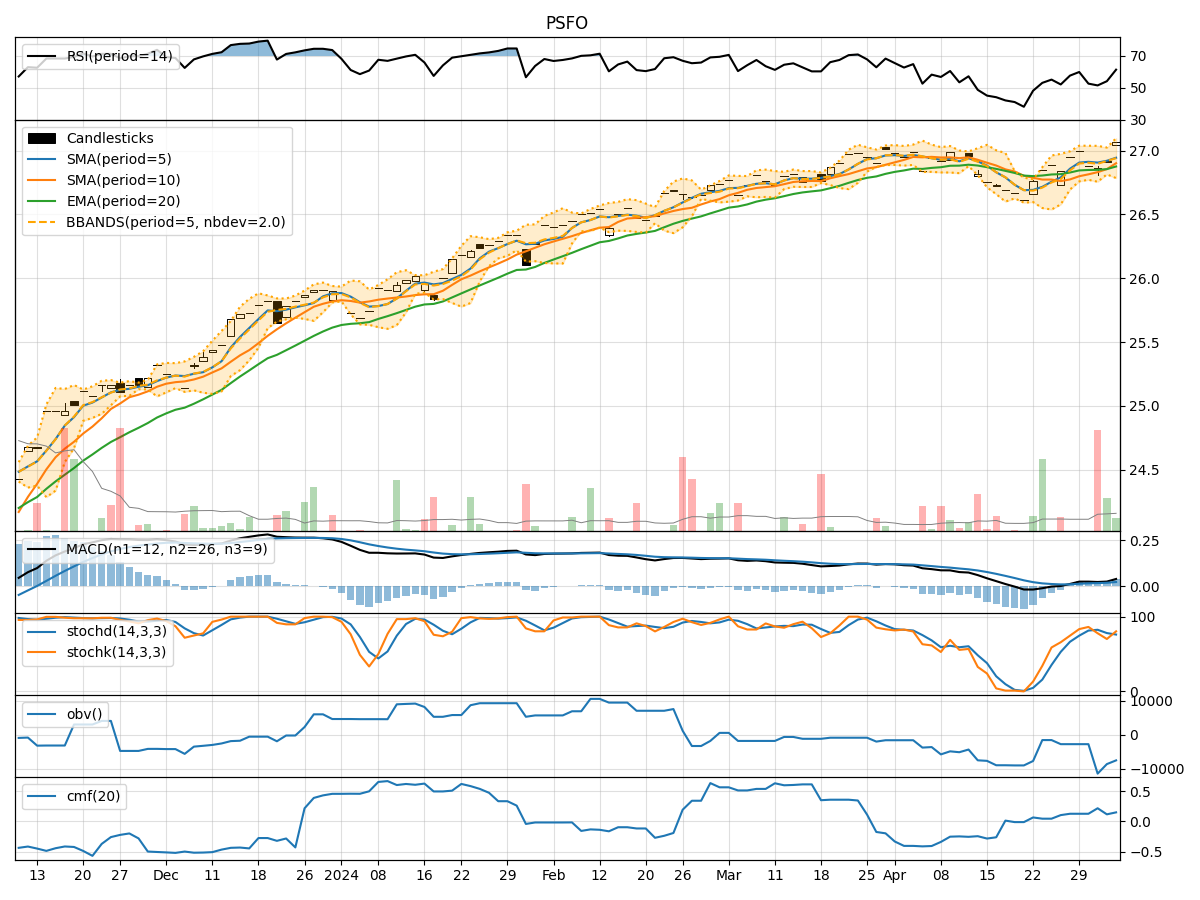
In analyzing the technical indicators for PSFO stock over the last 5 days, we will delve into the trend, momentum, volatility, and volume indicators to provide a comprehensive outlook on the possible stock price movement in the coming days. By examining these key indicators, we aim to offer valuable insights and predictions to guide investment decisions.
Trend Indicators:
- Moving Averages (MA): The 5-day MA has been consistently above the 10-day SMA, indicating a short-term bullish trend. The EMA(20) has shown a gradual uptrend, suggesting positive momentum.
- MACD: The MACD line has been above the signal line, with both lines showing an upward trajectory. The MACD histogram has been increasing, indicating strengthening bullish momentum.
Momentum Indicators:
- RSI: The RSI has been in the overbought territory, suggesting a strong bullish momentum in the stock.
- Stochastic Oscillator: Both %K and %D have been in the overbought zone, indicating a potential reversal or consolidation in the near term.
- Williams %R: The Williams %R has been hovering around the oversold region, signaling a potential buying opportunity.
Volatility Indicators:
- Bollinger Bands (BB): The stock price has been trading within the upper Bollinger Band, indicating an overbought condition. The bands are relatively narrow, suggesting a period of low volatility.
- Bollinger %B: The %B indicator has been above 0.8, indicating a potential overbought situation.
Volume Indicators:
- On-Balance Volume (OBV): The OBV has shown a slight decline, indicating some distribution in the stock.
- Chaikin Money Flow (CMF): The CMF has been positive, suggesting buying pressure in the stock.
Key Observations and Opinions:
- Trend: The trend indicators suggest a bullish bias in the stock, supported by the moving averages and MACD.
- Momentum: The momentum indicators indicate a strong bullish momentum, but the overbought conditions on RSI and Stochastic suggest a potential reversal or consolidation.
- Volatility: The low volatility indicated by the Bollinger Bands and %B suggests a period of consolidation or sideways movement.
- Volume: The slight decline in OBV may indicate profit-taking, but the positive CMF signals ongoing buying interest.
Conclusion:
Based on the analysis of the technical indicators, the next few days' possible stock price movement for PSFO is likely to experience a consolidation phase with a potential for a slight pullback due to the overbought conditions on RSI and Stochastic. However, the overall trend remains bullish, supported by the moving averages and MACD. Traders should watch for signs of a reversal or consolidation before considering new positions.