Technical Analysis of PSK 2024-05-10
Overview:
In analyzing the technical indicators for PSK stock over the last 5 days, we will delve into the trend, momentum, volatility, and volume indicators to provide a comprehensive outlook on the possible future stock price movement. By examining these key indicators, we aim to offer valuable insights and predictions for the upcoming trading days.
Trend Analysis:
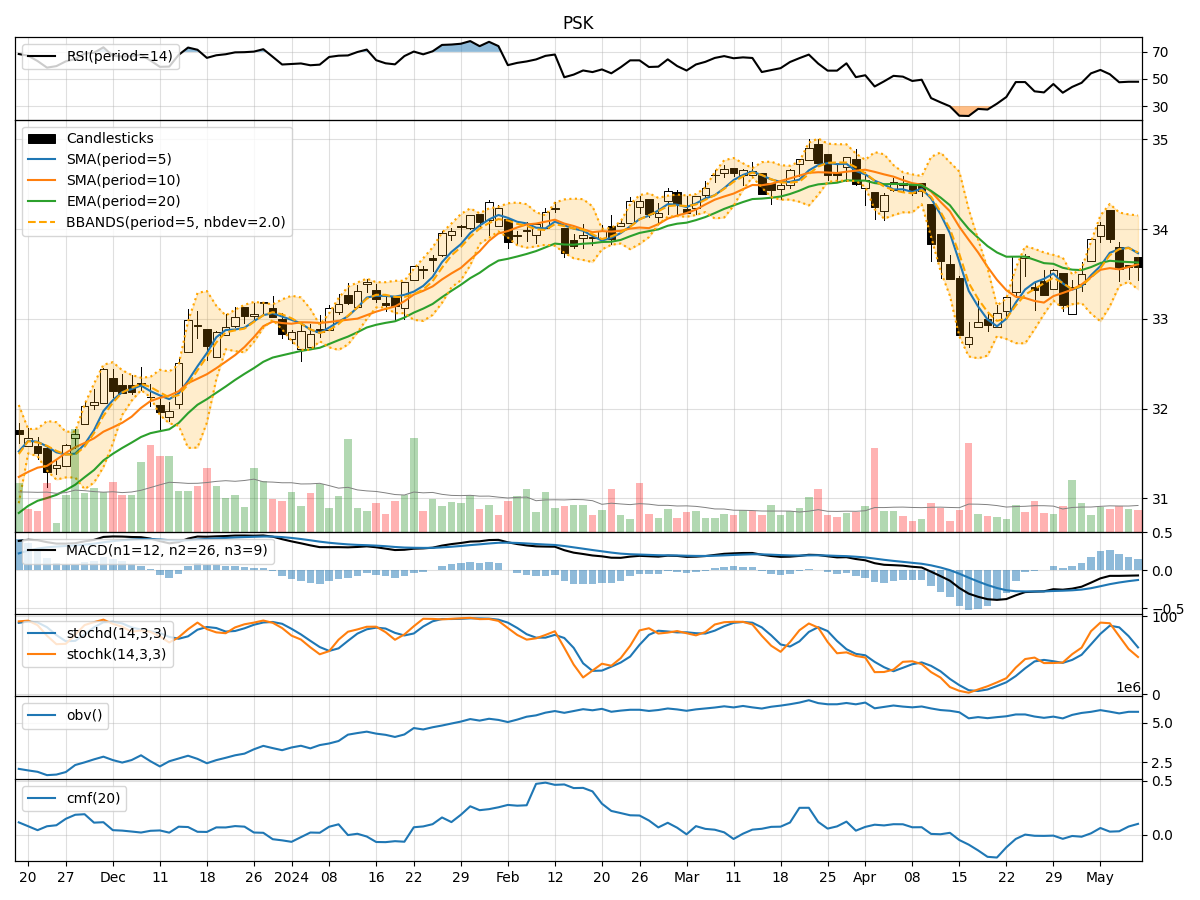
- Moving Averages (MA): The 5-day MA has been fluctuating around the closing prices, indicating a lack of clear trend direction.
- MACD: The MACD line has been consistently below the signal line, suggesting a bearish momentum in the short term.
- RSI: The RSI values have been declining, indicating a weakening bullish momentum.
Key Observation: The trend indicators are showing mixed signals with a slight bearish bias.
Momentum Analysis:
- Stochastic Oscillator: The Stochastic K and D lines have been decreasing, signaling a potential bearish momentum.
- Williams %R: The Williams %R values have been consistently in the oversold territory, indicating a bearish sentiment.
Key Observation: Momentum indicators are pointing towards a bearish outlook in the short term.
Volatility Analysis:
- Bollinger Bands (BB): The stock price has been trading within the Bollinger Bands, suggesting a period of consolidation.
- BB% (Bollinger Band %B): The BB% values have been fluctuating around the midline, indicating a lack of strong trend direction.
Key Observation: Volatility indicators suggest a period of consolidation and indecision in the market.
Volume Analysis:
- On-Balance Volume (OBV): The OBV values have been fluctuating, indicating a balance between buying and selling pressure.
- Chaikin Money Flow (CMF): The CMF values have been relatively low, suggesting a lack of strong buying or selling pressure.
Key Observation: Volume indicators reflect a neutral stance with no clear dominance of buying or selling pressure.
Conclusion:
Based on the analysis of trend, momentum, volatility, and volume indicators, the overall outlook for PSK stock in the next few days is bearish. The trend indicators show a lack of clear direction, while momentum indicators point towards a bearish sentiment. Volatility indicators suggest a period of consolidation, and volume indicators indicate a balanced market sentiment.
Therefore, the possible stock price movement for PSK in the next few days is likely to be on a downward trajectory. Traders and investors should exercise caution and consider potential short-term selling opportunities.