Technical Analysis of PSL 2024-05-10
Overview:
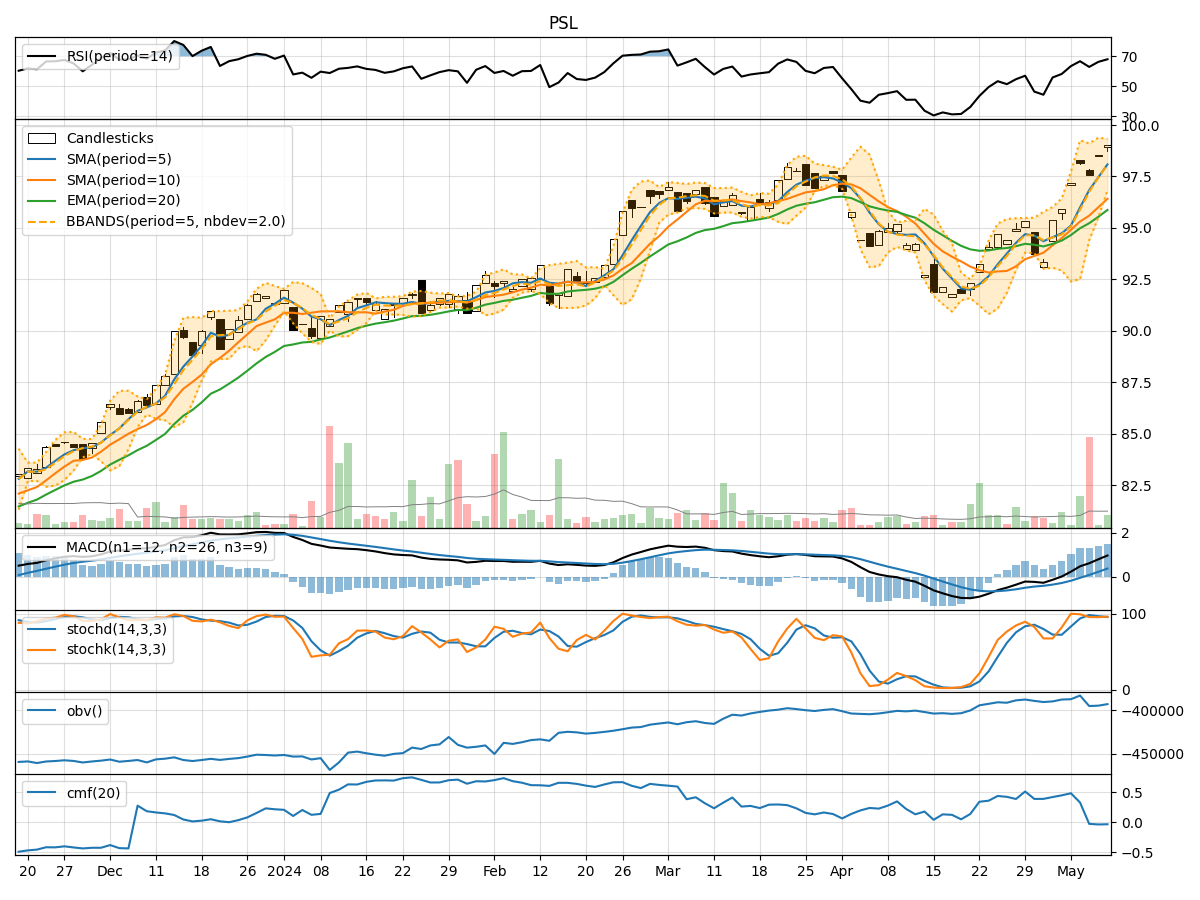
In analyzing the provided Technical Analysis (TA) data for the last 5 days of PSL stock, we will delve into the trend, momentum, volatility, and volume indicators to forecast the possible stock price movement in the upcoming days. By examining these key indicators, we aim to provide a comprehensive and insightful prediction for the future direction of PSL stock.
Trend Indicators:
- Moving Averages (MA): The moving averages show a consistent uptrend over the last 5 days, with the MA(5) steadily increasing. This indicates a positive trend in the stock price.
- MACD: The MACD line has been consistently above the signal line, suggesting bullish momentum in the stock.
- EMA: The Exponential Moving Average has been on an upward trajectory, supporting the bullish sentiment in the stock.
Momentum Indicators:
- RSI: The Relative Strength Index has been in the overbought territory, indicating strong buying momentum in the stock.
- Stochastic Oscillator: Both %K and %D have been relatively high, signaling potential overbought conditions.
- Williams %R: The Williams %R is also in the oversold region, suggesting a potential reversal in the stock price.
Volatility Indicators:
- Bollinger Bands: The Bollinger Bands have been widening, indicating increased volatility in the stock price.
- Bollinger %B: The %B indicator has been hovering around the upper band, suggesting a potential overbought condition.
Volume Indicators:
- On-Balance Volume (OBV): The OBV has shown mixed signals, with fluctuations in volume accumulation.
- Chaikin Money Flow (CMF): The CMF has been negative, indicating potential selling pressure in the stock.
Key Observations:
- The trend indicators suggest a strong bullish sentiment in the stock, supported by moving averages and MACD.
- Momentum indicators indicate potential overbought conditions, signaling a need for caution.
- Volatility indicators show increased price fluctuations, which could lead to sharp movements in either direction.
- Volume indicators reflect mixed signals, with OBV showing some accumulation but CMF indicating selling pressure.
Conclusion:
Based on the analysis of the technical indicators, the stock price of PSL is likely to experience a short-term correction or consolidation due to the overbought conditions indicated by momentum indicators and the potential selling pressure highlighted by volume indicators. Traders should exercise caution and consider taking profits or implementing risk management strategies in anticipation of a possible pullback in the stock price.