Technical Analysis of PSMD 2024-05-10
Overview:
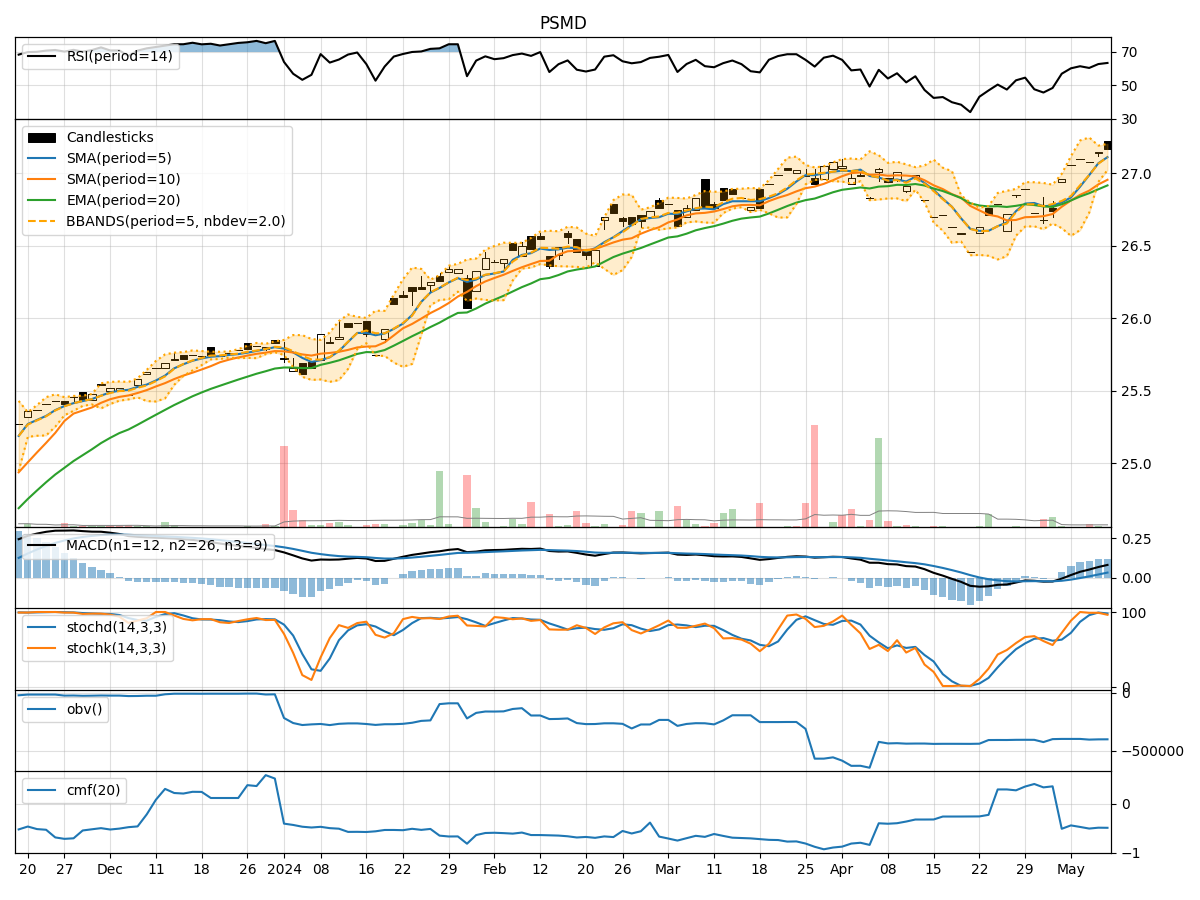
In the last 5 trading days, the stock price of PSMD has shown a slight upward trend with increasing volume. The trend indicators suggest a positive momentum, supported by the moving averages and MACD. The momentum indicators like RSI and Stochastic oscillators indicate a bullish sentiment. Volatility indicators show a narrowing Bollinger Band, indicating potential consolidation. Volume indicators also show a slight increase in buying pressure.
Trend Indicators Analysis:
- Moving Averages (MA): The 5-day MA is above the 10-day SMA, indicating a short-term bullish trend.
- MACD: The MACD line is above the signal line, suggesting a bullish momentum.
- EMA: The EMA is trending upwards, supporting the bullish sentiment.
Momentum Indicators Analysis:
- RSI: The RSI is in the overbought territory but still below 70, indicating potential room for further upside.
- Stochastic Oscillators: Both %K and %D are in the overbought zone, suggesting a strong bullish momentum.
Volatility Indicators Analysis:
- Bollinger Bands (BB): The narrowing of the Bollinger Bands indicates decreasing volatility and a potential period of consolidation.
- Bollinger Band Percentage (BBP): The BBP is above 0.8, suggesting the price is near the upper band, potentially indicating an overbought condition.
Volume Indicators Analysis:
- On-Balance Volume (OBV): The OBV has shown a slight increase, indicating a rise in buying pressure.
- Chaikin Money Flow (CMF): The CMF is negative, suggesting some selling pressure, but the 20-day period may need to be considered for a more accurate assessment.
Key Observations:
- The stock is currently in a short-term bullish trend supported by moving averages and MACD.
- Momentum indicators like RSI and Stochastic oscillators indicate a strong bullish sentiment.
- Volatility is decreasing, suggesting a potential consolidation phase.
- Buying pressure is slightly increasing based on volume indicators.
Conclusion:
Based on the analysis of the technical indicators, the next few days for PSMD stock price movement could be upward with a potential for further bullish momentum. However, caution should be exercised as the stock is in the overbought territory according to RSI and Stochastic indicators. The narrowing Bollinger Bands suggest a period of consolidation may be imminent before any significant upward movement. Traders and investors should closely monitor the price action and key support/resistance levels for potential entry or exit points.