Technical Analysis of PSMO 2024-05-10
Overview:
In analyzing the technical indicators for PSMO over the last 5 days, we will delve into the trend, momentum, volatility, and volume indicators to provide a comprehensive outlook on the possible stock price movement. By examining these key indicators, we aim to offer valuable insights and predictions for the upcoming days.
Trend Analysis:
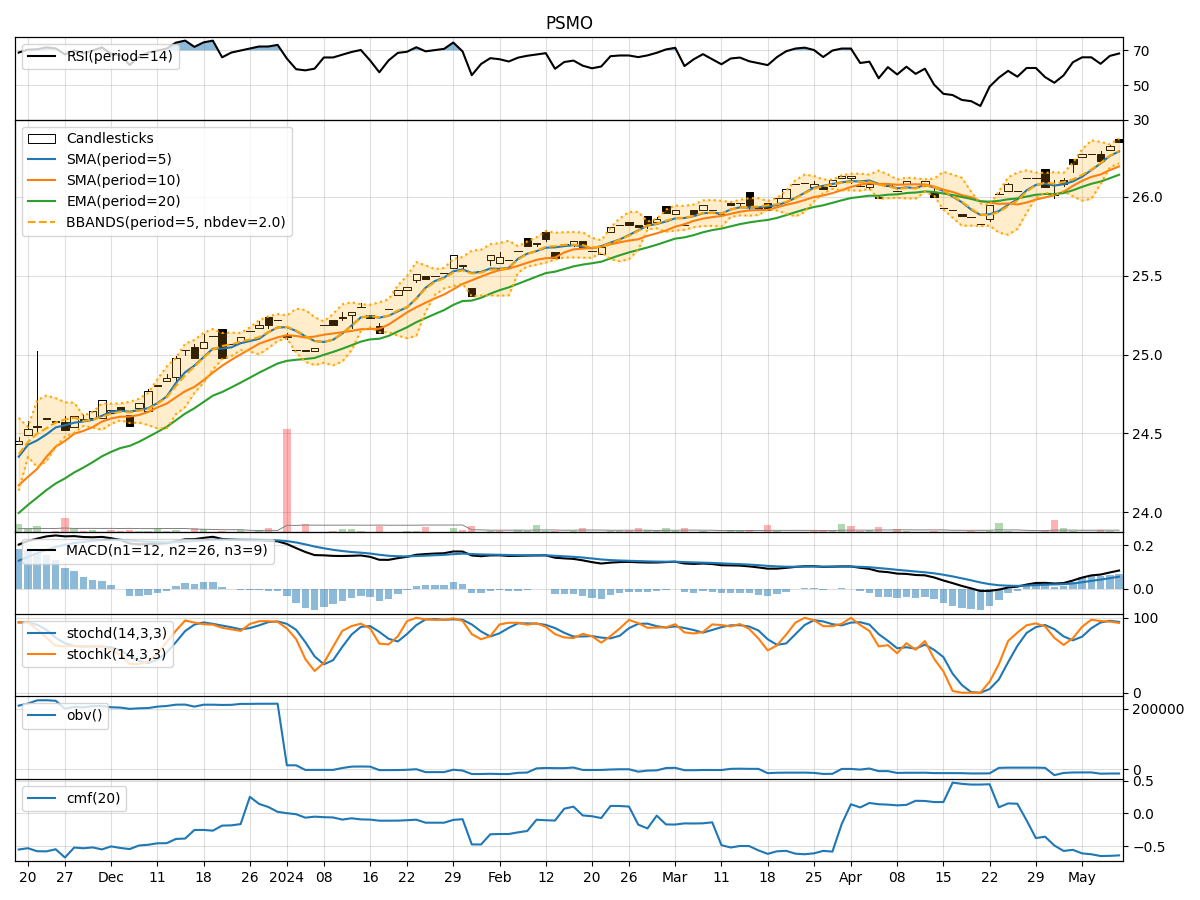
- Moving Averages (MA): The 5-day Moving Average (MA) has been consistently above the Simple Moving Average (SMA) and Exponential Moving Average (EMA), indicating a bullish trend.
- MACD: The MACD line has been consistently above the signal line, with both lines showing an upward trend, suggesting bullish momentum.
Key Observation: The trend indicators suggest a bullish sentiment in the stock price movement.
Momentum Analysis:
- RSI: The Relative Strength Index (RSI) has been hovering around 65-68, indicating a neutral to slightly overbought condition.
- Stochastic Oscillator: Both %K and %D have been in the overbought zone, suggesting a potential reversal or consolidation.
Key Observation: Momentum indicators show a neutral to slightly overbought stance.
Volatility Analysis:
- Bollinger Bands (BB): The stock price has been trading within the Bollinger Bands, with the bands narrowing, indicating decreasing volatility.
Key Observation: Volatility indicators point towards decreasing volatility in the stock.
Volume Analysis:
- On-Balance Volume (OBV): The OBV has shown mixed signals, with some days indicating buying pressure and others showing selling pressure.
- Chaikin Money Flow (CMF): The CMF has been consistently negative, indicating a lack of buying pressure.
Key Observation: Volume indicators suggest mixed signals with a slight bias towards selling pressure.
Conclusion:
Based on the analysis of the technical indicators, the next few days' possible stock price movement for PSMO is likely to be sideways with a slight bullish bias. The trend indicators signal a bullish sentiment, while momentum indicators show a neutral to slightly overbought condition. Volatility is expected to decrease, indicating a potential consolidation phase. However, the mixed signals from volume indicators suggest a cautious approach.
Overall Assessment: The stock is likely to experience a period of consolidation with a potential upward bias. Traders should closely monitor key support and resistance levels for potential entry and exit points.
Disclaimer:
This analysis is based solely on technical indicators and historical data, and actual market movements may vary. It is essential to consider other factors and conduct thorough research before making any investment decisions.