Technical Analysis of PSMR 2024-05-10
Overview:
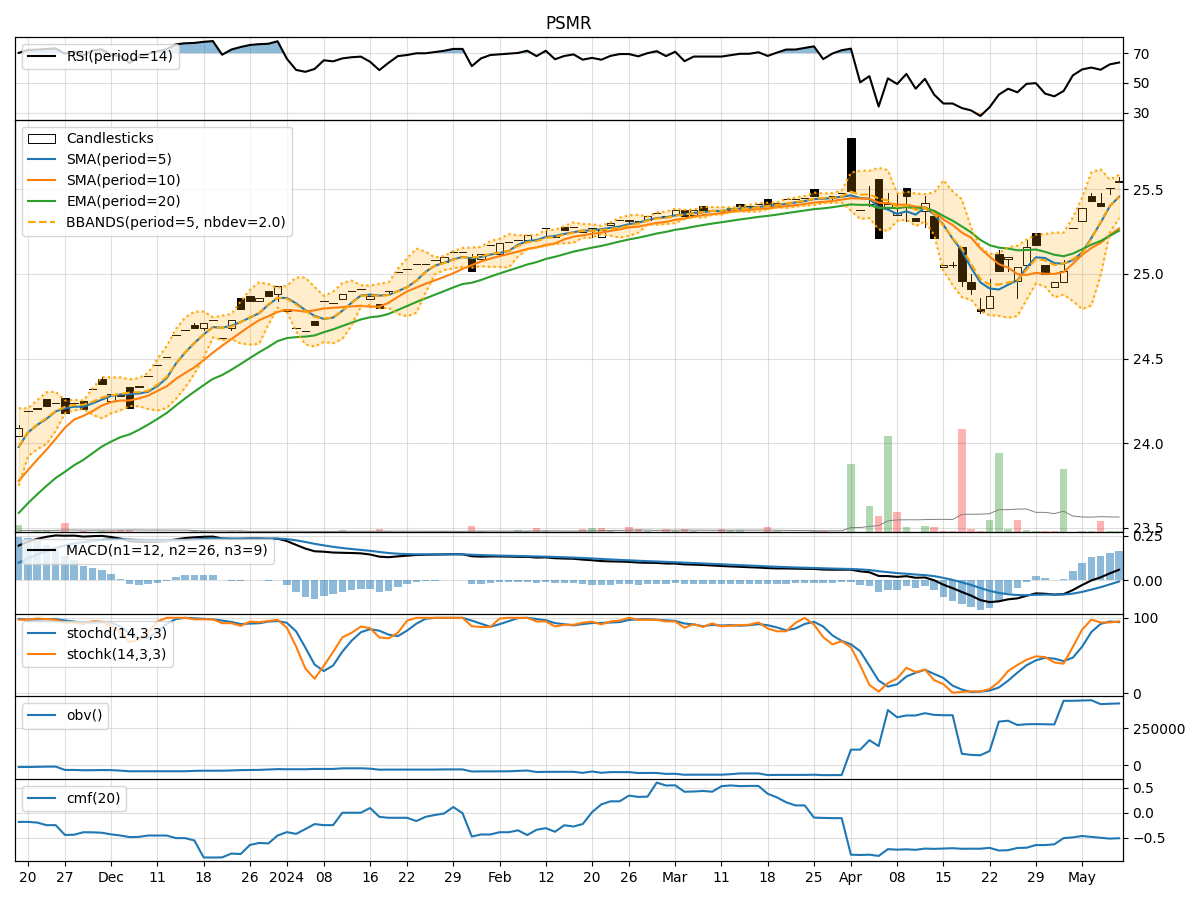
In analyzing the provided PSMR TA data for the last 5 days, we will delve into the technical indicators across trend, momentum, volatility, and volume to derive insights into the possible future stock price movement of the company. By examining these indicators, we aim to provide a comprehensive and informed prediction for the upcoming days.
Trend Analysis:
- Moving Averages (MA): The 5-day Moving Average (MA) has been consistently above the Simple Moving Average (SMA) and Exponential Moving Average (EMA), indicating a bullish trend.
- MACD: The MACD line has been consistently above the signal line, with both lines showing an upward trend, suggesting bullish momentum.
- RSI: The Relative Strength Index (RSI) has been fluctuating around the overbought territory, indicating strong buying pressure.
Momentum Analysis:
- Stochastic Oscillator: Both %K and %D lines of the Stochastic Oscillator have been in the overbought zone, suggesting a potential reversal or consolidation.
- Williams %R: The Williams %R indicator has been hovering around oversold levels, indicating a possible buying opportunity.
Volatility Analysis:
- Bollinger Bands (BB): The stock price has been trading within the Bollinger Bands, with the bands narrowing, indicating decreasing volatility.
- BB %B: The %B indicator has been relatively stable, suggesting a lack of extreme price movements.
Volume Analysis:
- On-Balance Volume (OBV): The OBV has been fluctuating, indicating mixed buying and selling pressure.
- Chaikin Money Flow (CMF): The CMF has been negative, suggesting a net outflow of money from the stock.
Key Observations:
- The trend indicators suggest a strong bullish sentiment in the short term.
- Momentum indicators show signs of potential overbought conditions, hinting at a possible correction or consolidation.
- Volatility indicators point towards decreasing price fluctuations.
- Volume indicators reflect mixed market participation and a slight bearish bias.
Conclusion:
Based on the analysis of the technical indicators, the stock is likely to experience further upward movement in the next few days, supported by the bullish trend and momentum. However, caution is advised as the momentum indicators signal potential overbought conditions, which could lead to a short-term correction or consolidation. Traders should closely monitor the Stochastic Oscillator and Williams %R for signs of a reversal. Overall, the outlook remains bullish with a possibility of short-term consolidation.