Technical Analysis of PSR 2024-05-10
Overview:
In analyzing the provided Technical Analysis (TA) data for the last 5 days, we will delve into the trend, momentum, volatility, and volume indicators to forecast the possible stock price movement for the next few days. By examining these key indicators, we aim to provide a comprehensive and insightful analysis to guide investment decisions.
Trend Indicators:
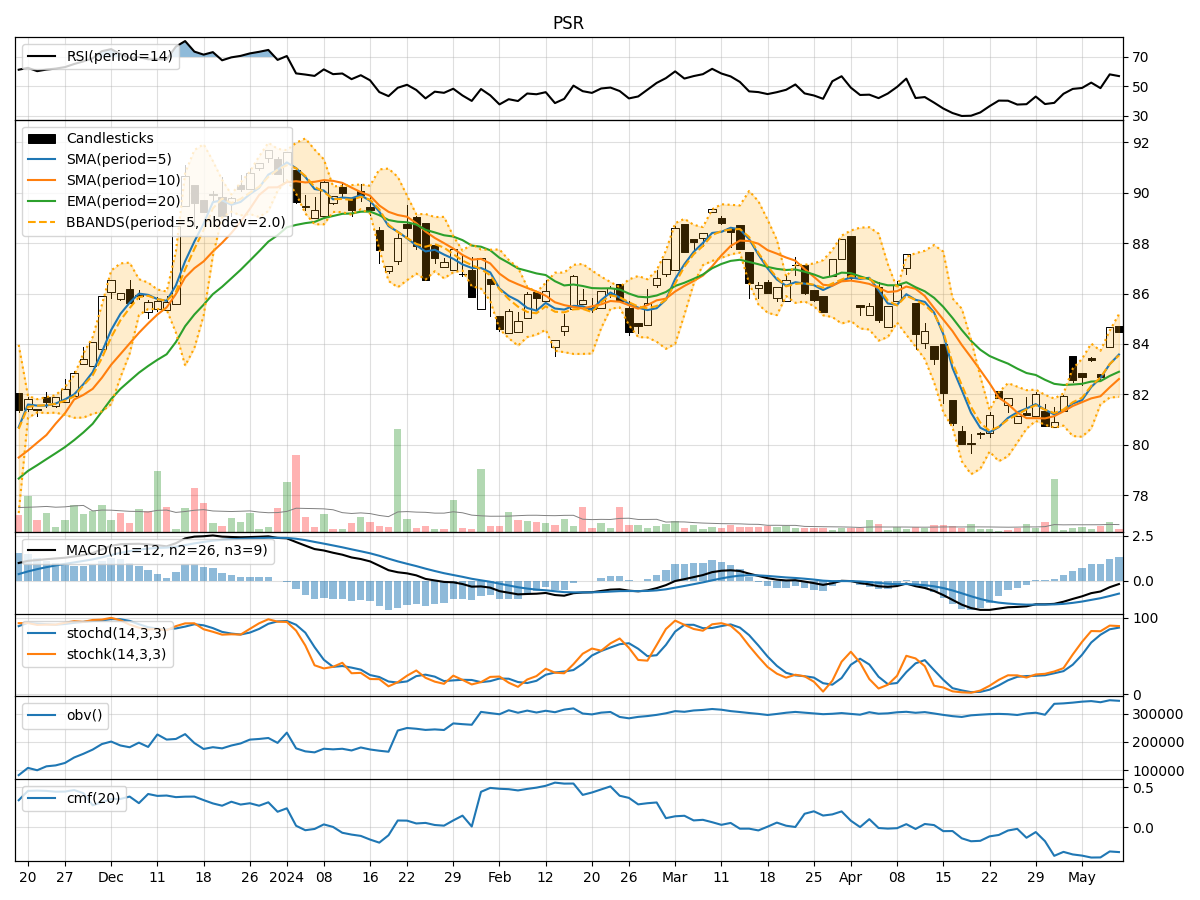
- Moving Averages (MA): The 5-day Moving Average (MA) has been trending upwards, indicating a positive short-term trend in stock price.
- MACD (Moving Average Convergence Divergence): The MACD line has been consistently above the signal line, suggesting bullish momentum.
- EMA (Exponential Moving Average): The EMA has been steadily increasing, supporting the bullish trend.
Key Observation: The trend indicators point towards an upward trend in the stock price.
Momentum Indicators:
- RSI (Relative Strength Index): RSI values have been fluctuating around the mid-level, indicating a balanced momentum.
- Stochastic Oscillator: Both %K and %D values have been in the overbought zone, suggesting a potential reversal.
- Williams %R (Willams Percent Range): The Willams %R is hovering near oversold levels, signaling a possible buying opportunity.
Key Observation: Momentum indicators suggest a mixed sentiment with a slight bearish bias.
Volatility Indicators:
- Bollinger Bands (BB): The stock price has been trading within the Bollinger Bands, indicating normal volatility.
- Bollinger Band Width (BBW): The BBW has remained relatively stable, reflecting consistent volatility levels.
- Bollinger Band %B (BBP): The %B indicator shows the stock price is currently trading close to the upper band.
Key Observation: Volatility indicators suggest a stable price movement with a slight bullish bias.
Volume Indicators:
- On-Balance Volume (OBV): The OBV has shown mixed signals with fluctuations in volume accumulation.
- Chaikin Money Flow (CMF): The CMF has been negative, indicating selling pressure in the market.
Key Observation: Volume indicators reflect uncertainty in market sentiment with a bearish inclination.
Conclusion:
Based on the analysis of trend, momentum, volatility, and volume indicators, the next few days' possible stock price movement is likely to be sideways with a slight bullish bias. While the trend indicators suggest an upward trajectory, momentum and volume indicators indicate a mixed sentiment with bearish tendencies. Volatility remains stable, supporting a potential bullish outlook. Traders should closely monitor key support and resistance levels for potential entry and exit points.
Recommendation:
- Short-term Traders: Consider taking profit at key resistance levels and closely monitor momentum indicators for potential reversals.
- Long-term Investors: Hold positions with a cautious approach, considering the mixed signals from momentum and volume indicators.
- Risk Management: Implement stop-loss orders to protect gains and mitigate potential losses in case of unexpected market movements.
By combining insights from various technical indicators, investors can make informed decisions and adapt their strategies to navigate the dynamic stock market environment effectively.